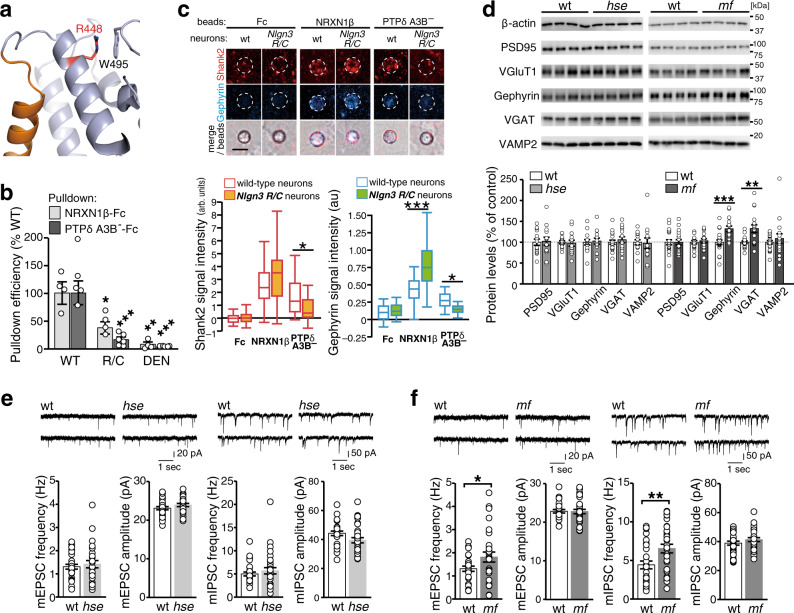
Fig. 6. Phenotypic resemblance between Nlgn3R/C ASD model and Nlgn3mf mice.
a Close-up view of the area around Arg448 of NLGN3. Arg448 and Trp495 are shown as sticks. The coloring scheme is the same as that in Fig. 3a, except that Arg448 is colored in red. b Pulldown efficiencies of wild-type NLGN3 (WT), NLGN3-R448C (R/C), and NLGN3-DEN/AAA (DEN) by NRXN1β and PTPδA3B– (n = 4 and 6 experiments for NRXN1β and PTPδA3B–, respectively). c NRXN1β- and PTPδA3B–-induced excitatory and inhibitory postsynaptic differentiation in Nlgn3R/C cortical neurons were visualized by Shank2 (red) and gephyrin (blue) immunostaining (top) and quantified (n = 27 and 30 Fc-beads, 29 and 31 NRXN1β-beads, and 36 and 33 PTPδA3B–-beads for wild-type and Nlgn3R/C neurons, respectively) (bottom). Scale bar, 5 μm. d Representative immunoblots (top) and quantification of expression levels (bottom) of synaptic proteins in Nlgn3hse and Nlgn3mf mutant mice and their wild-type littermates (N = 14 each for Nlgn3hse and wild-type littermates; N = 20 and 18 for Nlgn3mf and wild-type littermates, respectively). e and f Representative mEPSC and mIPSC traces and summary graphs from layer 2/3 pyramidal neurons of somatosensory cortex in acute slices of Nlgn3hse (e) and Nlgn3mf (f) mutant mice (n = 28, 31, 29, and 27 cells from 4 Nlgn3hse, 6 wild-type, 5 Nlgn3mf, and 5 wild-type mice, respectively for mEPSC; n = 33, 27, 32 and 31 cells from 6 Nlgn3hse, 4 wild-type, 6 Nlgn3mf, and 7 wild-type mice, respectively for mIPSC). Data in (c) are presented as box plots. Horizontal line in each box shows the median, box shows the IQR and the whiskers are 1.5 × IQR. Data in (b, d, e, and f) represent mean ± s.e.m. *p < 0.05, **p < 0.01 and ***p < 0.001, Tukey’s test in (b and c), and two-sided Student’s t-test in (d and f). See Supplementary Table 4 for additional statistics and exact p values.

