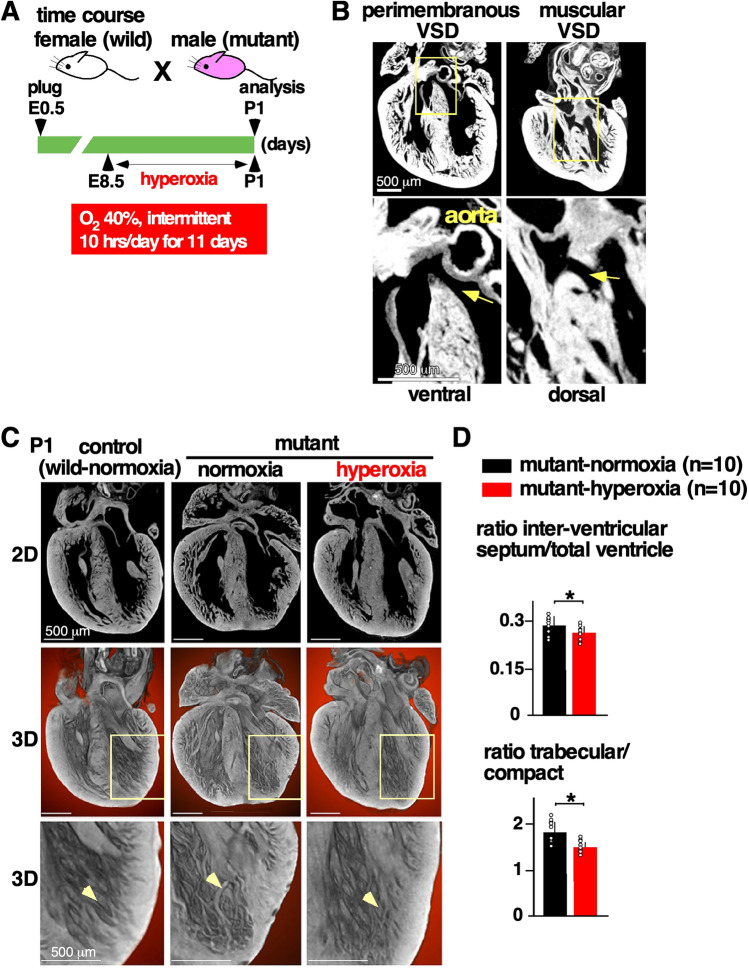
Figure 2.
Experimental design of gestational hyperoxia (40% O2 saturation) and representative images of postnatal day 1 Nkx2-5 mutant hearts using micro-computed tomography (CT). (A) Timeline of experiment. (B) Representative 2D images demonstrating perimembranous and muscular VSD regarding their location (arrows). (C) Representative 2D and 3D micro-CT images showing ventricular trabeculation (arrowheads). (D) Quantification of area size of total ventricle, inter-ventricular septum, trabecular and compact layers. Data are expressed as mean ± S.D.; individual data are represented as circles. The Shapiro–Wilk normality test confirmed normal distribution of variables. *P ≤ 0.05. VSD ventricular septal defect. ImageJ 1.52d (http://imagej.nih.gov/ij) was used for analysis.

