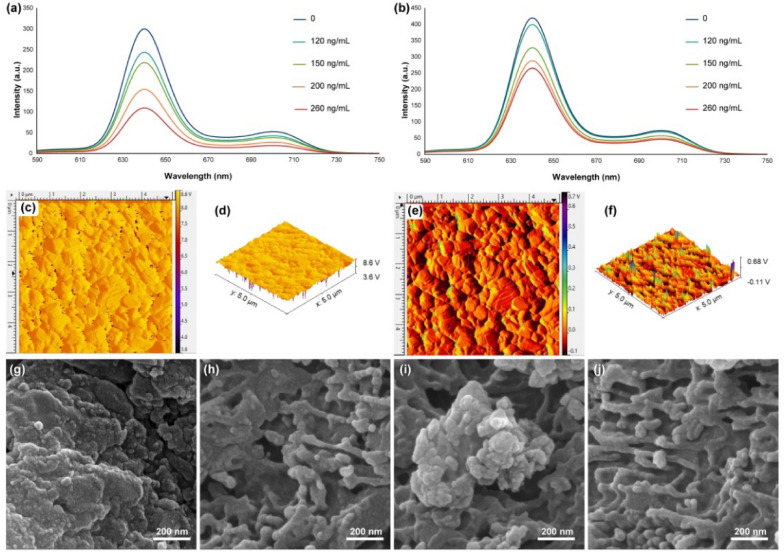
Figure 4.
Fluorescence emission spectra of the synthesized 3D nanocomposite in the presence of different concentrations of PMA added to the HEK-293 (a) and PC12 (b) cell lines. 2D (c) and 3D (d) AFM images and (g and h) FESEM images of the synthesized 3D nanocomposite after removing from the PC12 culture and exposure to the hydrogen peroxide; 2D (e) and 3D (f) AFM images and (i and j) FESEM images of the synthesized 3D nanocomposite after removing from the HEK-293 culture and exposure to the hydrogen peroxide.

