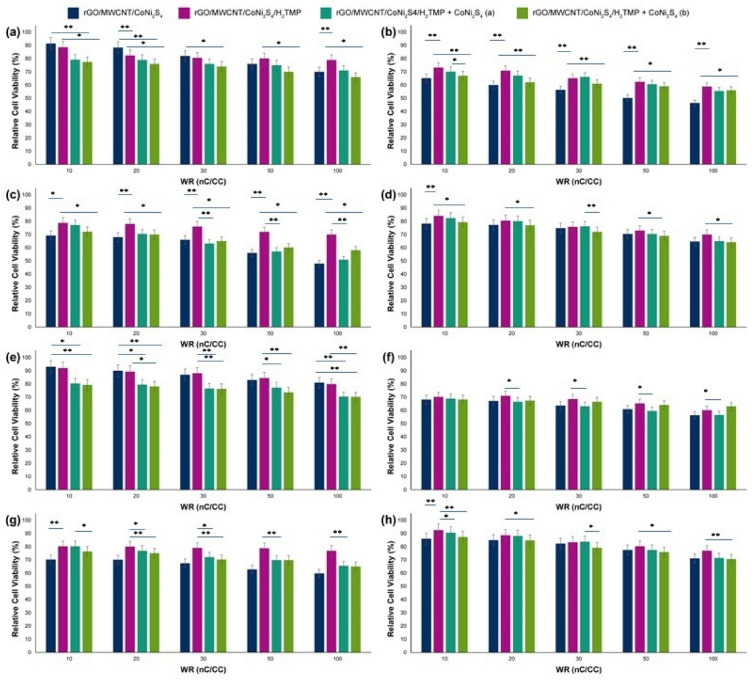
Figure 5.
MTT results of the rGO/MWCNT/CoNi2S4, rGO/MWCNT/CoNi2S4/H2TMP, rGO/MWCNT/CoNi2S4/H2TMP + CoNi2S4 (a) and rGO/MWCNT/CoNi2S4/H2TMP + CoNi2S4 (b) on the (a) HEK-293, (b) HeLa, (c) HepG2 and (d) PC12 cell lines after treatment time of 48 h; and rGO/MWCNT/CoNi2S4, rGO/MWCNT/CoNi2S4/H2TMP, rGO/MWCNT/CoNi2S4/H2TMP + CoNi2S4 (a) and rGO/MWCNT/CoNi2S4/H2TMP + CoNi2S4 (b) on the (e) HEK-293, (f) HeLa, (g) HepG2 and (h) PC12 cell lines after treatment time of 24 h; (a) represents for 10 mg mL−1 and (b) 20 mg mL−1 concentrations of the excess CoNi2S4. *p value < 0.05 and **p value < 0.01.

