Figure 7.
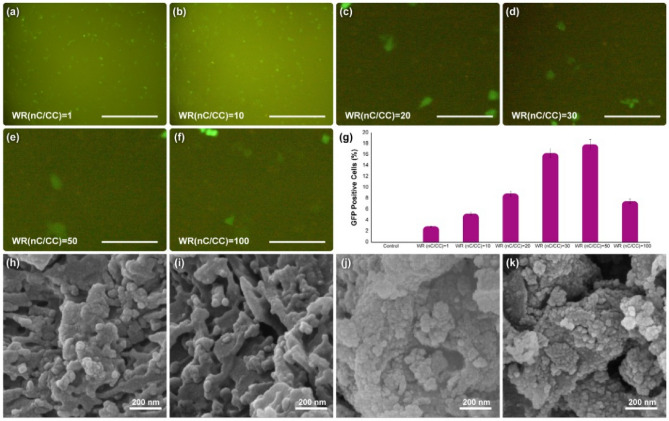
The results of (a–f) 2D fluorescence microscopy, and (g) GFP positive cells for the synthesized nanocomposite at different WR’s of nanocomposite (nC)/CRISPR/Cas9 (CC) on HEK-293 cell line. The data indicate the 2D fluorescence microscopy and EGFP read are presented as the mean (± SD) from three independent experiments. The Scale bar of (a,b) is 50 µm, and for (c–f) is 10 µm. The normal (h–i) FESEM analysis of the synthesized 3D nanocomposite degraded in the presence of different concentrations of hydrogen peroxide (same as the procedure conducted and shown in Fig. 3), and the normal (j–k) FESEM analysis of the synthesized 3D nanocomposite were removed from the cell culture after the pCRISPR gene transfection experiments.

