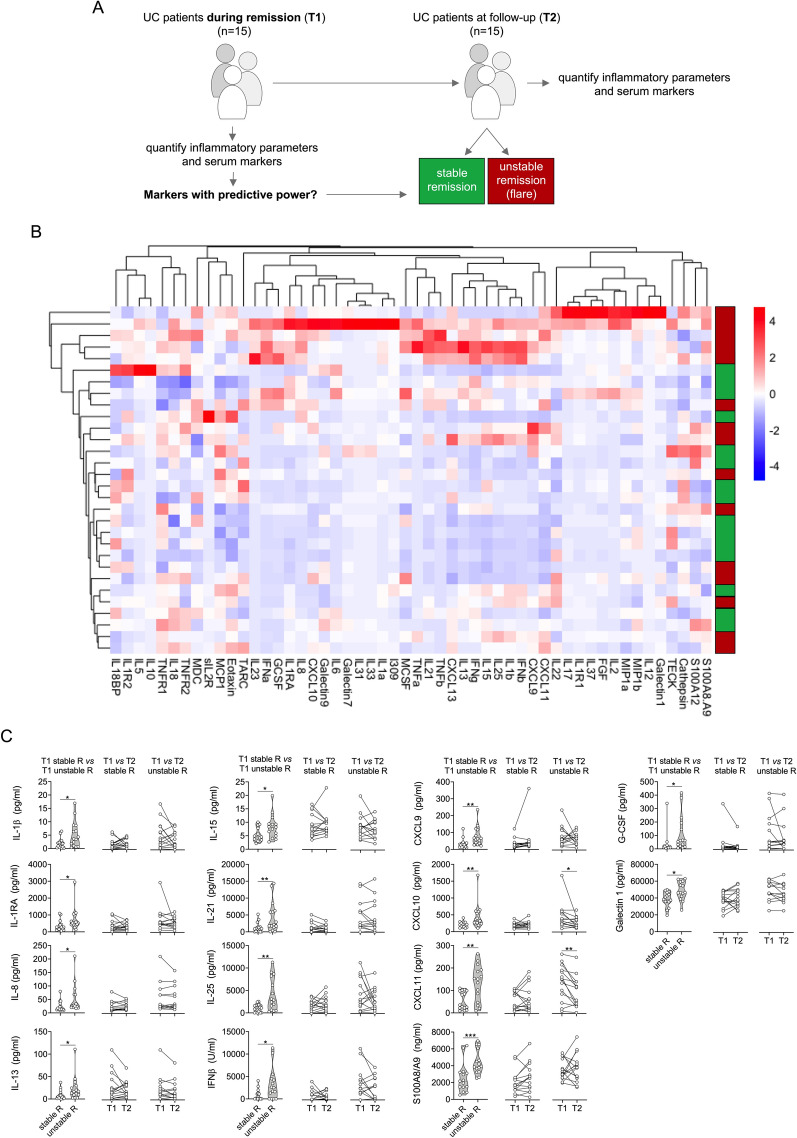
Figure 3.
Analysis of inflammatory parameters and multiplexed serum markers in UC. (A) Illustration of the experimental layout, restricted to UC patients during remission at inclusion (T1). Patients were followed-up over 1 year. Half of the patients had a relapse during follow-up. A second sample was obtained at T2, either at the time of the flare of at the end of follow-up in remission. (B) Heatmap of serum marker data from bead array assay, ELISA data (S100A8/A9, S100A12) and routine inflammatory parameters (ESR, CRP, WBC) following unsupervised hierarchical clustering and complete linkage analyses (RStudio, R 3.5.0, the R Foundation for Statistical Computing, Vienna, Austria). (C) Markers with significantly different levels at T1 between IBD patients with stable remission (stable R) or unstable remission (unstable R) (left panel column), and comparison of respective marker levels between T1 and T2 during stable (middle panel column) or unstable remission (right panel column). Acquisition was performed with a BioRad FlexMAP3D (BioRad laboratories, Hercules, USA) in combination with xPONENT software, version 4.2 (Luminex). Data were analyzed using Bio-Plex Manager software, version 6.1.1 (BioRad). Data of individual serum biomarkers were analyzed by Mann–Whitney U or, when paired, by Wilcoxon signed rank test. *p < 0.05, **p < 0.01, ***p < 0.001.

