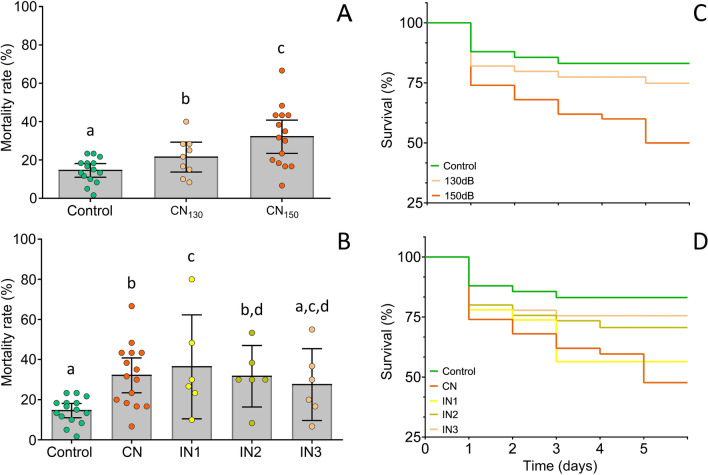
Figure 1.
Comparison of mean mortality rate between treatment groups (larval zebrafish up to 5 days post fertilization) exposed to (A) continuous noise at different amplitudes (F(2, 38) = 8.71, p < 0.001) and (B) varying noise temporal patterns (F(4, 47) = 3.78, p = 0.005). Kaplan–Meier percentual survival plot of zebrafish larvae throughout the 5-days of chronic acoustic treatments of (C) increasing noise amplitudes and (D) varying temporal patterns. Control- silent conditions, CN- continous noise at either 130 (CN130) or 150 dB re 1 μPa (CN150), IN- intermittent regime with short (IN1), medium (IN2) and long noise segments (IN3). Error bars represent 95% confidence intervals. Different letters indicate statistically significant differences between specific groups based on post hoc tests.

