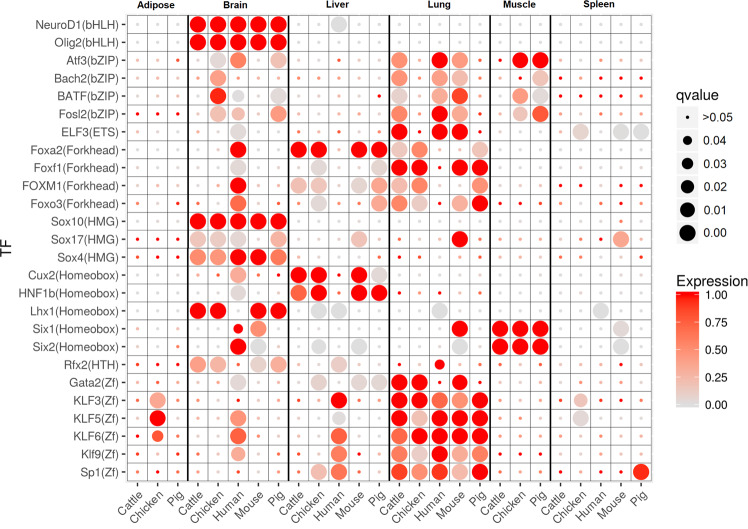
Fig. 3. Transcription factor motifs enriched in tissue-specific footprints show similar patterns across species.
Transcription factor motifs enriched in at least one tissue in all three domestic animal species. The size of the circle indicates the statistical significance of motif enrichment (Benjamini–Hochberg adjusted p-values using HOMER), while the color indicates the expression of the corresponding transcription factor gene, normalized to the maximum expression across tissues within each species.

