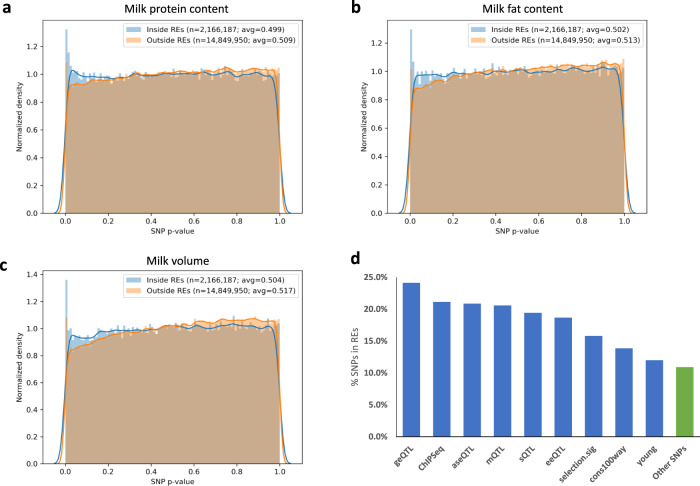
Fig. 5. Overlap with dairy cattle GWAS SNPs.
a–c The distribution of p-values from GWAS for milk protein content (a), milk fat content (b), and milk volume (c), for SNPs inside and outside of characterized REs in cattle. The p-values were calculated by previous studies from which the SNPs were obtained (citations in text). d The percentage of SNPs in REs categorized as geQTL (gene expression QTL), ChIPSeq (SNPs in ChIP-seq peaks from previously generated H3K4me3 and H3K27ac data from liver, muscle, and mammary gland), aseQTL (allele-specific expression QTL), mQTL (metabolites QTL), sQTL (splicing QTL), eeQTL (exon expression QTL), selection.sig (selection signature between dairy and beef cattle), cons100way (variants under genomic sites conserved across 100 vertebrate species), young (variants that are recently selected), and other SNPs not placed in any of the previous categories. SNPs may belong to multiple categories.

