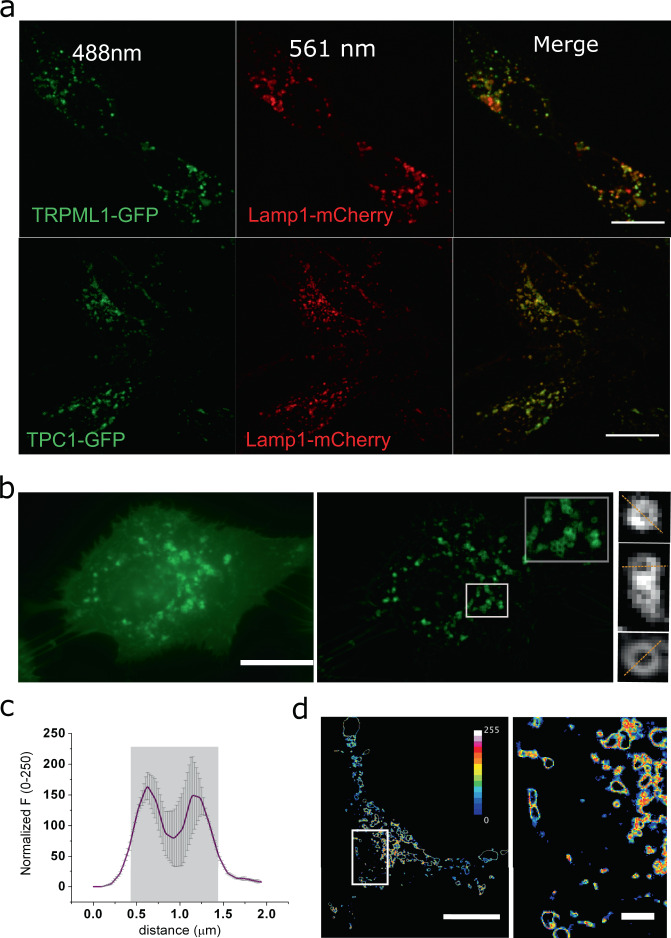
Fig. 2. Imaging of subcellular structures identified as lysosomes.
a Representative colocalization images of the lysosomal marker Lamp1 with the lysosomal ion channels TPC1-EGFP and TRPML1-EGFP. Scale bars correspond to 5 μm. b Raw image of a transiently transfected HEK293 cell expressing Lamp1-EGFP (left). FFT filtered and background-subtracted image (middle) allows the identification of individual lysosomes. Inset corresponds to a 6 × 6 µm zoom of the highlighted area. An average of 10 frames allows obtaining better resolved individual lysosome structures (right panel). The orange lines indicate the axis used to extract the intensity profile in Lamp1-positive objects. c Intensity versus distance plot showing the average size of lysosomes in the study. Gray values were collected along orange lines indicated in b. The average size of the doughnut-shaped objects was 112 ± 33 nm (n = 26). error bars correspond to SEM. d Mobility map of a cell expressing Lamp-EGFP (left; Scale bar, 10 μm). The white square indicates the region zoomed on the right panel (Scale bar, 2 μm). Red shades indicate zones with high motion and black represent regions containing immobile objects.

