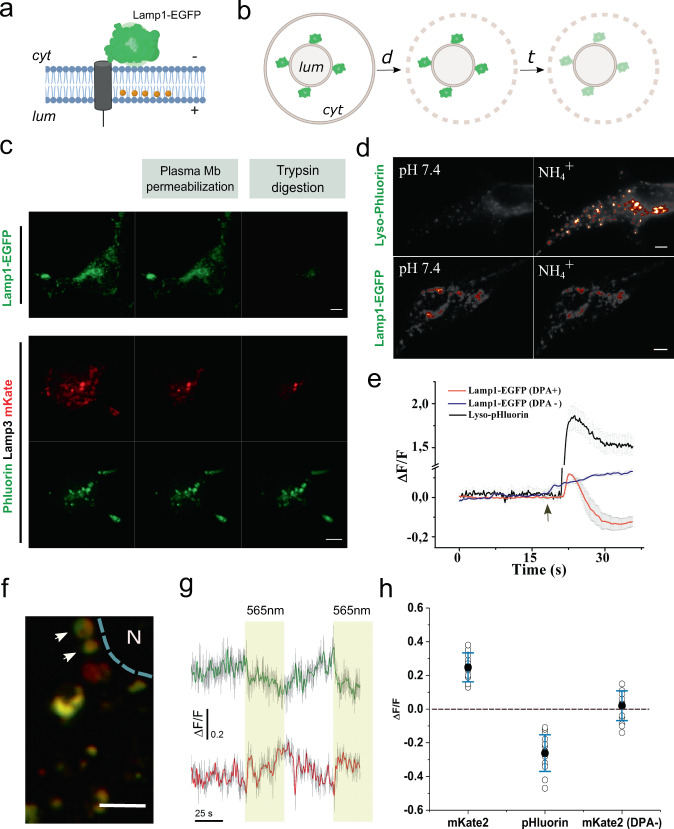
Fig. 3. Topology of Lamp1-EGFP and the effect of lysosomal pH on hVoSorg signals.
a Cartoon of the predicted topology of the FRET pair with EGFP facing the cytoplasm and DPA accumulated at the luminal leaflet of the lysosomal membrane. b Schematic representation of the FPP assay illustrating the position of the fluorescent tags relative the organelle membrane. A 2-min treatment with 10 μM digitonin (d) is followed by perfusion with ringer containing 4 mM trypsin (t). c Lamp1-EGFP exposes the fluorescent protein to the cytoplasm as revealed by protease protection assay (top) (scale bar, 5 μm). Representative image of HEK-293T cells expressing lyso-pHoenix (pHluorin-CD63-pHluorin-Arch3-mKate) were subjected to the FPP assay (bottom panels) (scale bar, 5 μm). d Representative images of HEK293 cells expressing the pH sensor pHluorin (top) or EGFP (bottom). Images were taken before (left) and after (right) ammonium treatment. e Time course of fractional fluorescence during ammonium treatments. The arrow denotes addition of NH4+. f Representative image of individual lysosomes expressing Lyso-pHoenix. Arrows indicate representative individual lysosomes. N indicates the position of the nucleus. (scale bar, 3 μm). g Traces of pH signal (green shades) and membrane voltage signal (red shades) acquired in response to light stimulation (indicated in yellow). Traces were obtained by averaging the response of the lysosomes indicated in f. Solid lines correspond to the smoothened signal. h Average values of ΔF/F for the change in membrane voltage (mKate2), luminal pH (pHluorin) (n = 5 independent paired experiments), and the voltage-insensitive mKate2 in the absence of the voltage sensor DPA (n = 3 independent experiments). Error bars indicate mean ± SD.

