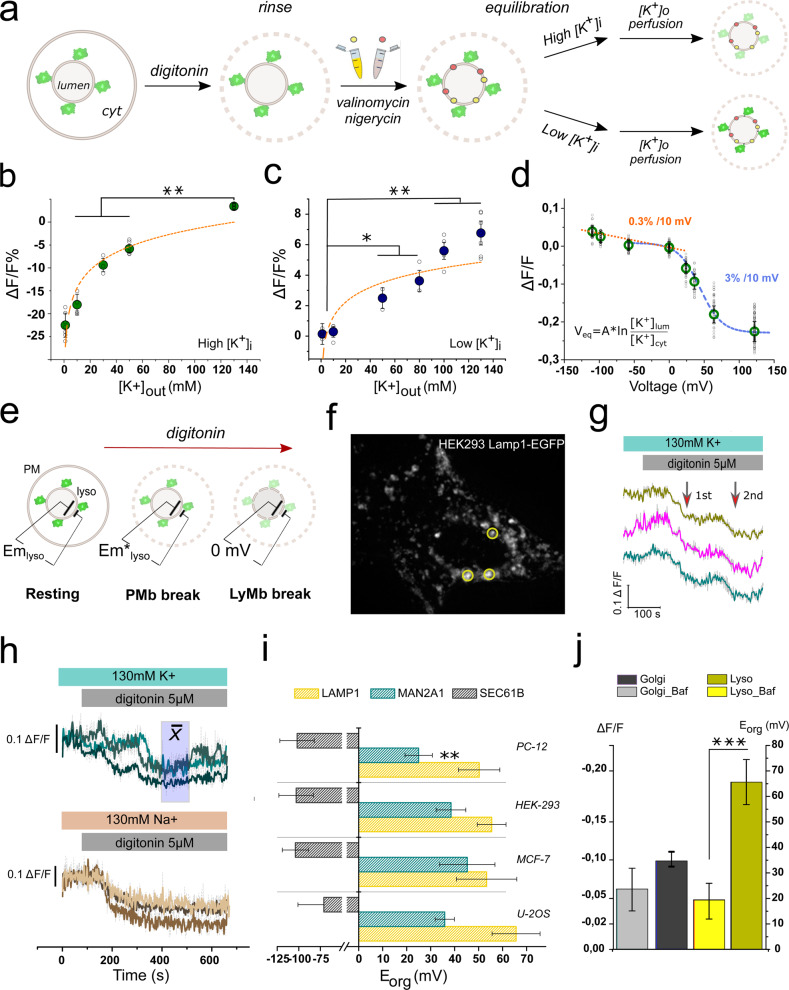
Fig. 4. Organellar membrane potentials measured at rest.
a Schematic representation of the In-cell calibration protocol by potassium clamp. After gentle permeabilization with digitonin cells were incubated with reaching endomembranes. After equilibration with either low or high potassium solutions organelles were perfused with a set of potassium-based solutions. b Averaged ΔF/F values evoked by the different potassium solutions in high intraluminal potassium (green circles). Empty circles correspond to the average of independent experiments. Orange dashed line corresponds to the best fit to GHK equation. *P < 0.05; **P < 0.01. c Averaged ΔF/F values for the different potassium solutions in low intraluminal potassium (blue circles). Empty circles correspond to the average of independent experiments. Solid orange trace corresponds to the best fit to GHK equation. *P < 0.05; **P < 0.01. d ΔF/F versus membrane potential relationship (n = 92 independent experiments). Empty circles correspond to the full set of replicates. The data set was extracted from experiments in b and c. The blue trace corresponds to the best fit to a single Boltzmann distribution function. The orange line corresponds to a linear fit. e Schematic representation of the experiment designed to obtain the resting potential of intracellular membranes. Two sequential steps of permeabilization corresponding to the plasma membrane and the lysosomal membrane are expected. The second permeabilization step brings Ψly to zero before the final disruption of the lysosomal membrane. f Representative image of the cells used for calibration procedures. Three individual lysosomes are indicated in circles. g Representative traces used to estimate the resting potential. Cells were incubated in potassium-based extracellular ringer and exposed to 10 µM digitonin as indicated on top. Two steps of fluorescence quenching are indicated with red arrows. h Sodium on the external solution eliminates the intermediate quenching step without affecting the final equilibrium condition. Squares in blue shades indicate regions of the recording interpreted as the lysosomal membrane at 0 mV. Average values for the change in fractional fluorescence were extracted from the indicated region. i Calculated resting membrane potential of lysosomes (n = 21 independent experiments), Golgi (n = 17 independent experiments), and ER (n = 14 independent experiments) for the cell types indicated. Error bars indicate mean ± SD. j Effect of pH on the resting membrane potential of lysosomes and Golgi (n = 6 independent experiments). Error bars indicate mean ± SD; ***P < 0.001).

