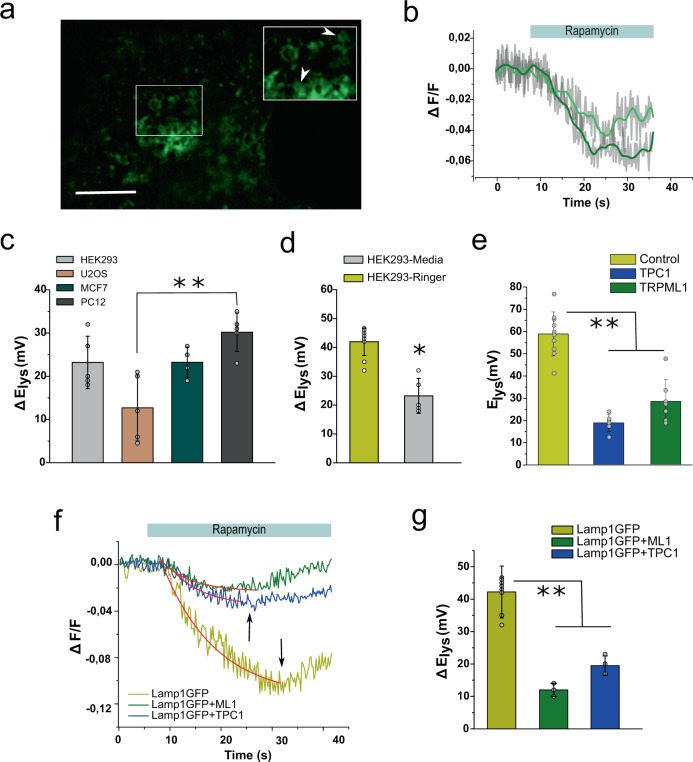
Fig. 5. Time-resolved imaging of rapamycin-induced lysosomal depolarization.
a Representative image of HEK293 cells transiently expressing Lamp1-EGFP. Bar = 5 µm. Inset. Two individual lysosomes are indicated with arrowheads. b Changes in fractional fluorescence (ΔF/F) induced by rapamycin in the two lysosomes indicated in a. c Rapamycin-induced electrical response in the four different cell types indicated (n = 7, 6, 5, and 5 independent experiments for HEK, U2OS, PC-12, and MCF7 cells respectively). d A larger rapamycin-induced response is observed in cells that are deprived from nutrients (n = 6 independent experiments per condition). e Transient overexpression of lysosomal resident channels alters normal membrane potential (n = 5 independent experiments per condition). f Representative traces of rapamycin-induced depolarization of lysosomes overexpressing lysosomal resident channels. Red traces correspond to first-order exponential decay function. Arrows indicate when membrane potential reaches 10 mV. g Changes in the lysosomal membrane potential in the presence of the mTOR inhibitor rapamycin (5 µM) (n = 5 independent experiments). Error bars indicate mean±SD; **P < 0.01.

