Figure 4.
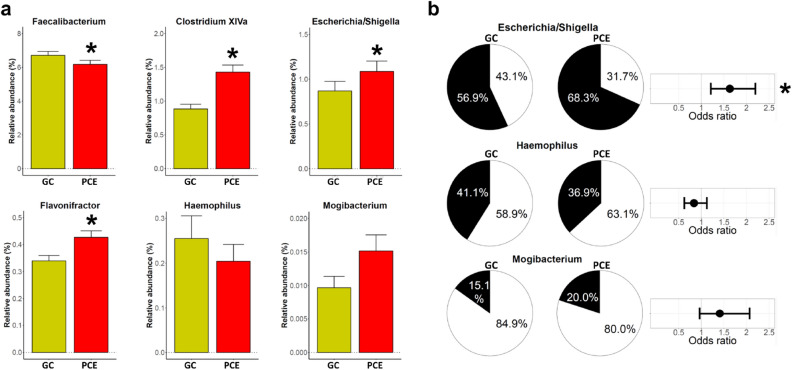
Differences in intestinal microbiota composition between individuals post-cholecystectomy (PCE) and gallstone carriers (GC). (a) Barplots (mean + sem) display taxon abundance of the PCE subsample (n = 404, red) and GC cases (n = 404, yellow). (b) Pie charts are displaying the fraction of non-zero samples (in black) of the PCE subsample and GC cases. The odds ratios represent the reduced or increased likelihood of the respective taxon to be present in the PCE subsample compared to GC cases. *Indicates a significant result.

