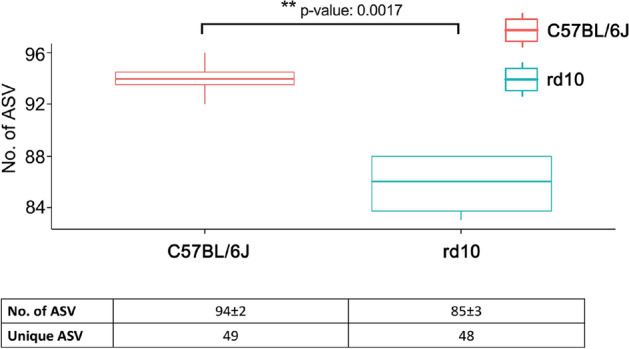
Figure 3.

Amplicon sequence variant analysis. Top panel: boxplot comparing the number of amplicon sequence variants (No. of ASV). One-way ANOVA test showed statistically significant differences between the number of ASV in healthy (red) and rd10 (blue) mice. First row of the table contains mean ± SD of ASV, the second one contains the number of unique ASV (not shared with the other group) for healthy (left) and rd10 mice (right). Graphic performed with the library ggboxplot available in R.
