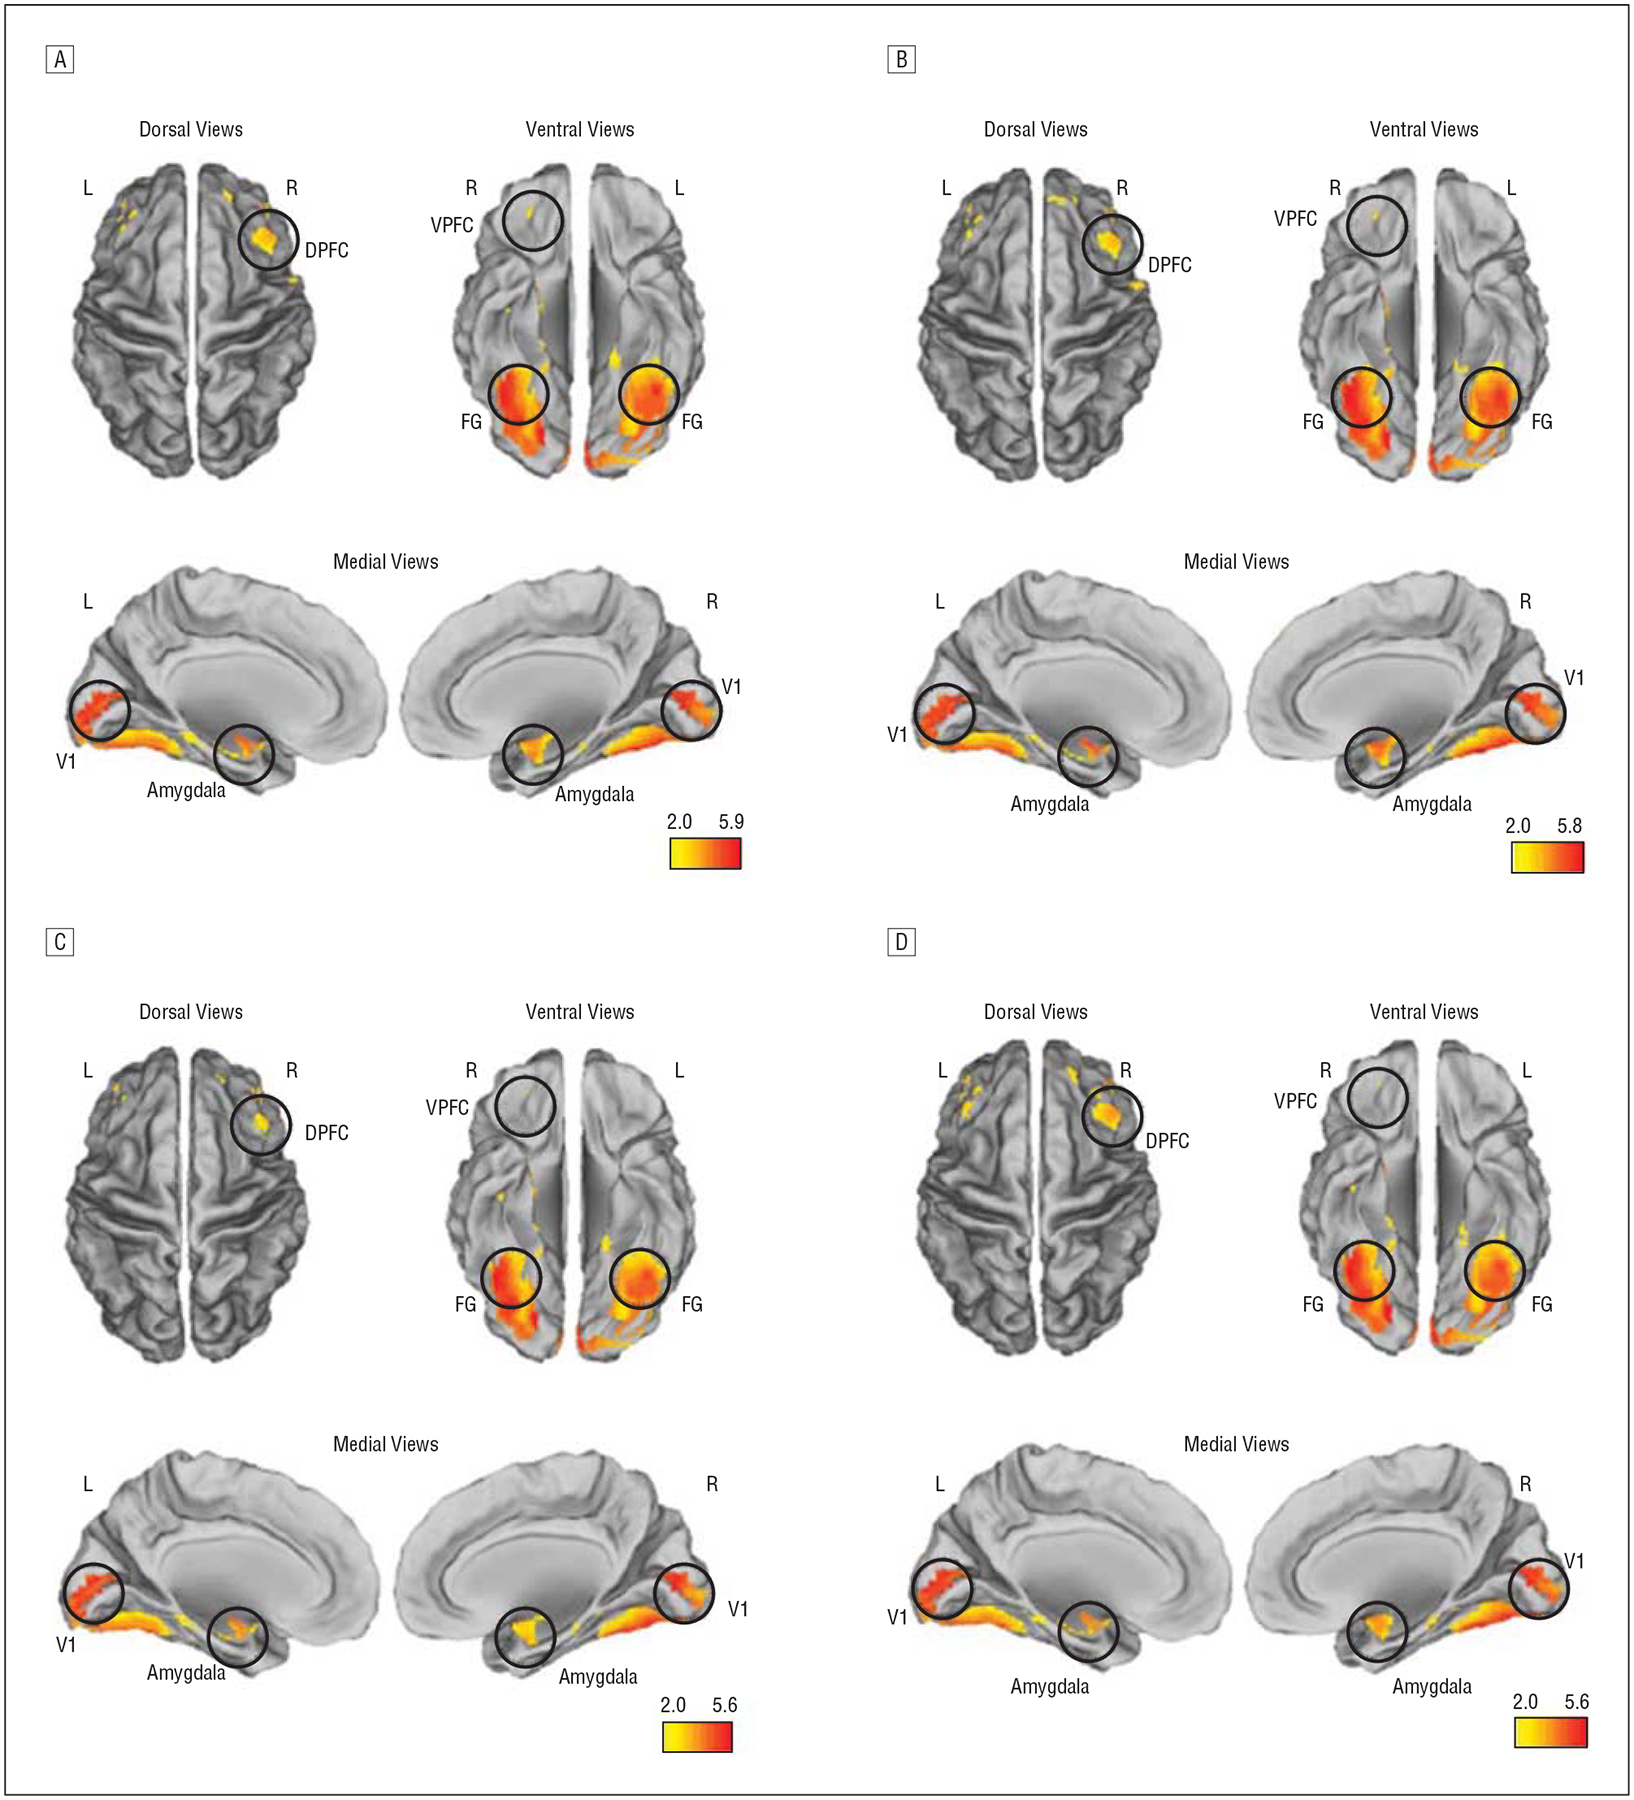
Figure 2.

Results of a conjunction analysis in control subjects and children and adolescent offspring of patients with schizophrenia (HR-SCZ subjects) depict widespread overlap in activation in both groups in our network of interest. A, All faces. B, Negative valence. C, Neutral valence. D, Positive valence. Significant clusters (P<.05, corrected at cluster level) are depicted on dorsal, ventral, and medial surface projections. DPFC indicates dorsal prefrontal cortex; FG, fusiform gyrus; L, left; R, right; V1, primary visual cortex; and VPFC, ventral prefrontal cortex. The color bars represent the conjunction statistic and are unitless. Table 2 provides statistical information.
