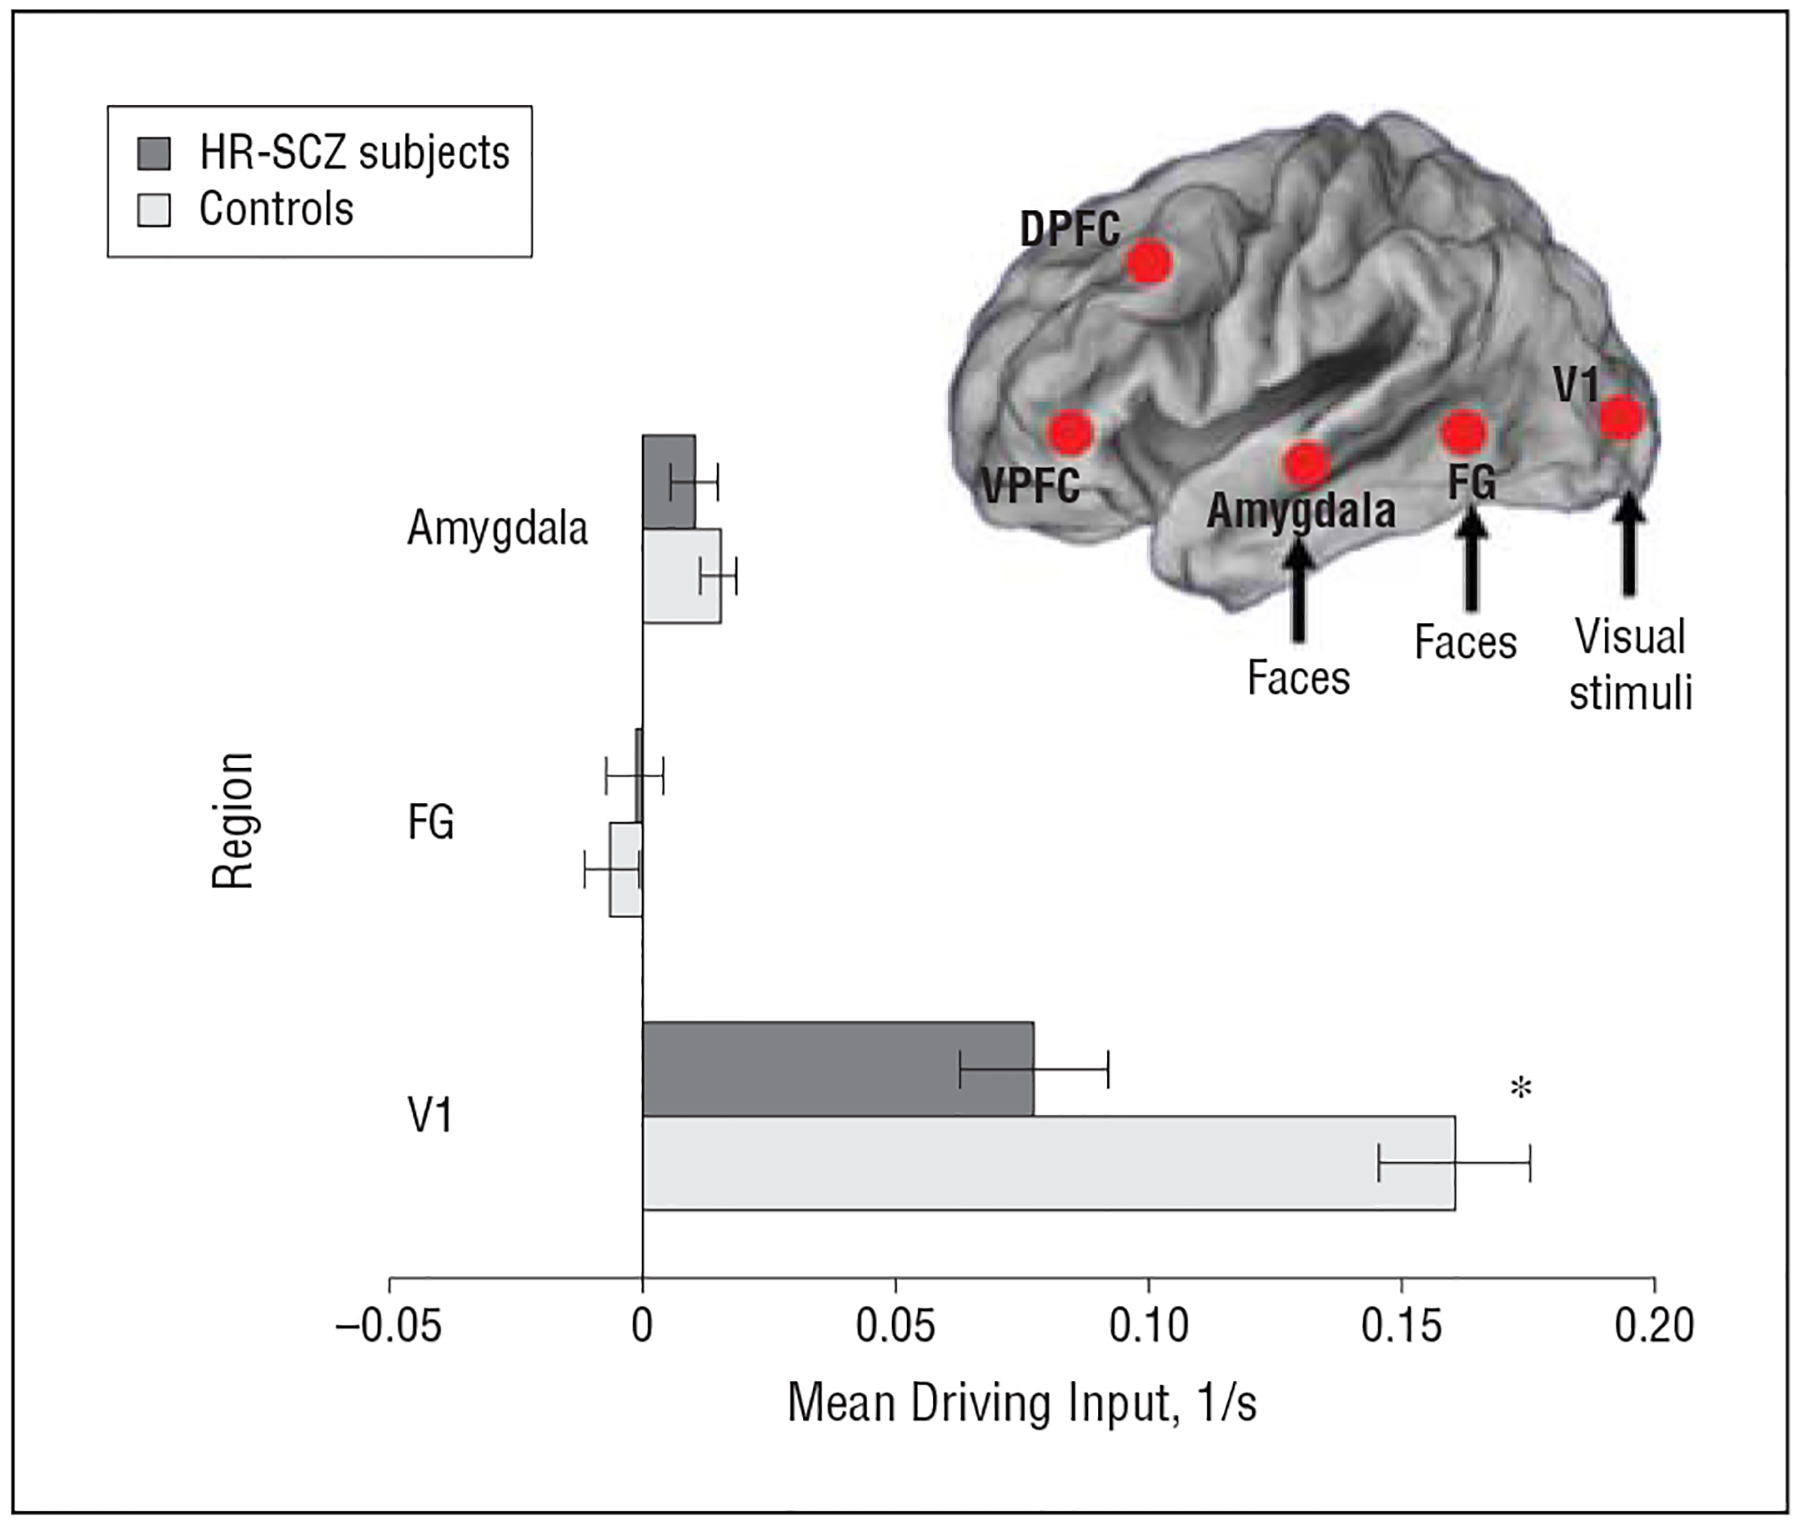
Figure 4.

Mean driving inputs for control subjects and children and adolescent offspring of patients with schizophrenia (HR-SCZ subjects) for the winning model depicted in Figure 3C. Differences in coupling parameter estimates between the control group and HR-SCZ group are depicted. *P=.01, Bonferroni-corrected familywise error rate. The t statistics are provided in eTable 1. Error bars represent standard deviations derived from Bayesian parameter averages. DPFC indicates dorsal prefrontal cortex; FG, fusiform gyrus; V1, primary visual cortex; and VPFC, ventral prefrontal cortex.
