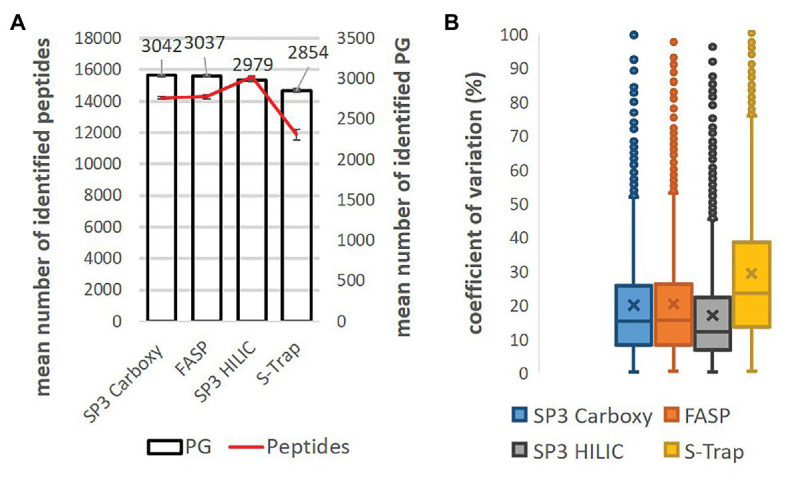
Figure 2.

Comparison of SP3 Carboxy, FASP, SP3 HILIC, and S-Trap performance (18 h digestion, trypsin:protein 1:10, three replicates). (A) Mean number of identified protein groups (bar chart) and peptides (line chart). Technical variability of protein group and peptide detection is displayed as error bars. (B) Coefficients of variation of protein group intensity (%). Only shared protein groups (n = 1986) across the whole dataset were considered. Median normalization was applied [data were log(2) transformed].
