Figure 3.
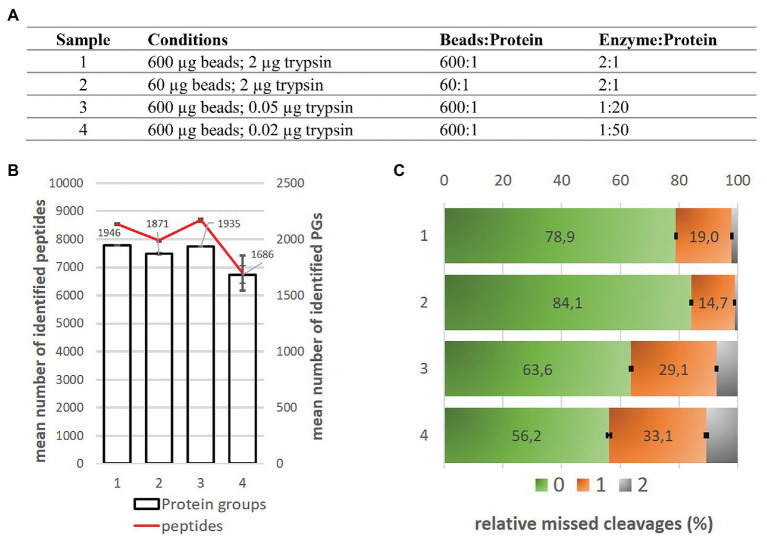
Comparison of SP3 Carboxy method performance for 1 μg input amount of Arabidopsis thaliana samples. (A) The overview of conditions applied in this experiment. (B) Mean number of protein groups and peptides identified under given conditions. Technical variability of protein groups and peptide detection is displayed as error bars for three replicates. (C) Relative missed cleavages content (%) corresponds to the number of identified peptides without any missed cleavage (green), with one (orange) and two (gray) missed cleavages. Data were calculated as an average value from three replicates. Standard deviation was applied for error bars calculation.

