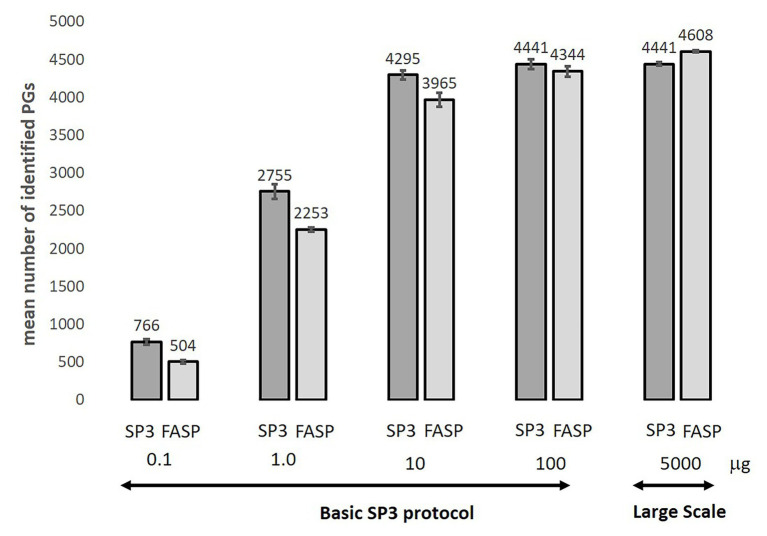
Figure 5.
Comparison of mean number of identified protein groups for SP3 and FASP methods over-tested protein load range. Standard deviation was applied for error bars calculation. Data were calculated as the average value from 3 or 5 (100 μg) replicates. The only half of the final digested sample was injected for 0.1–1 μg input amounts to prevent loss of sample from technical issues. In case of higher sample loads (≥10 μg), we injected about 2 μg of tryptic peptide mixture.

