
Figure 6.
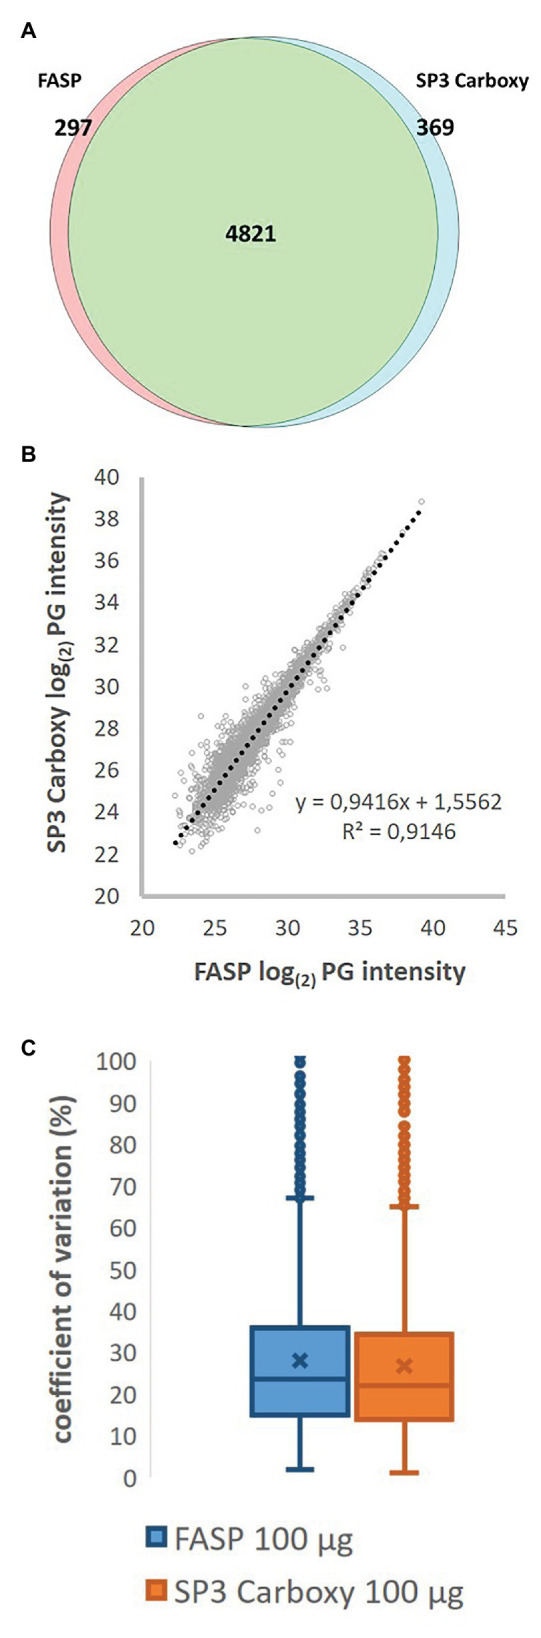
Qualitative and quantitative comparison of FASP and Basic SP3 protocol (100 μg protein input, pentaplicate). (A) Overlap of identified unique protein groups. (B) Scatter plot of log2 transformed intensities of shared PGs. Median intensity and median normalization approach were employed to calculate protein group intensity. (C) Coefficient of variation of shared PGs intensities.