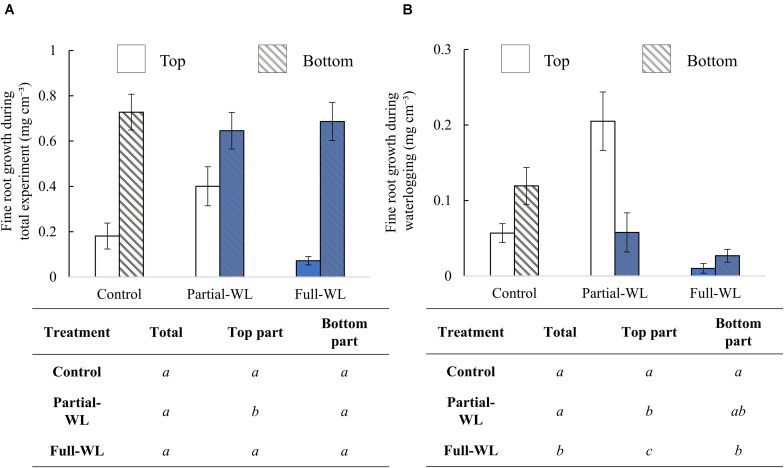
FIGURE 2.
Mean fine root growth (±SE) during (A) the whole experiment period (IGtotal) and (B) waterlogging treatment period (IGwl) (n = 15 for each treatment and position). Solid bars are results from the top part (11 cm from soil surface), and hatched bars are results from the bottom part (15 cm from the bottom). Bars which are colored with blue are results obtained from waterlogged soils. The result of Tukey–Kramer’s multiple comparison test or Steel–Dwass multiple comparison test (IGtotal: top, IGwl: total and top part) is shown in the table below the figures. Statistical difference was tested among treatments at the top part, bottom part, and total (top + bottom), respectively. Different italic letters show statistical difference (p < 0.05).

