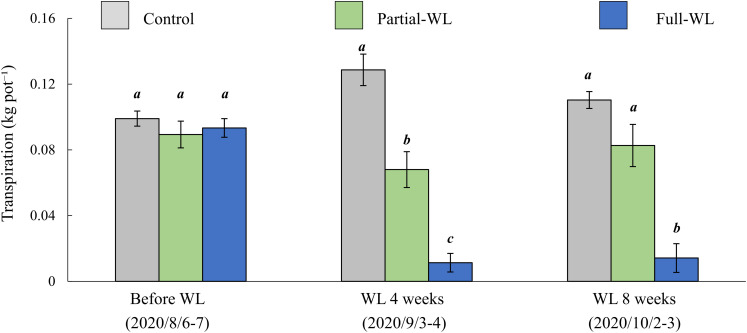
FIGURE 4.
Mean transpiration (±SE) before waterlogging treatment (August 8–6), 4 weeks after waterlogging (September 3–4), and 8 weeks after waterlogging (October 2–3). Gray bars, green bars, and blue bars are the result of control, partial waterlogging (partial-WL), and full waterlogging (full-WL), respectively (n = 15). Results of the Tukey–Kramer’s multiple comparison test are shown with different italic letters indicating statistical differences (p < 0.05) between treatments at each measurement period.

