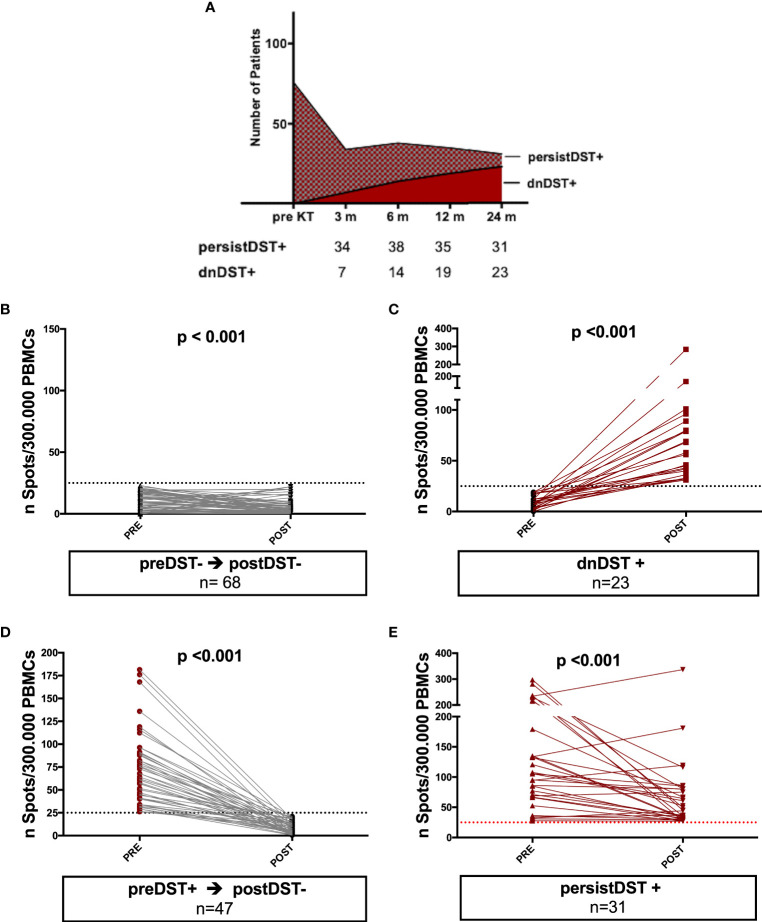
Figure 3.
Kinetics of posttransplant de novo DST and changes of mean donor-reactive IFN-γ T-cell frequencies between pre and posttransplantation in different groups of patients. (A) At month 3, 6, 12, and 24 months 7, 7, 5, and 4 patients developed dnDST, and 34, 38, 35 and 31 were PersistDST+ respectively. (B–E) All preDST− remaining DST− and preDST+ becoming postDST− showed significantly lower T-cell frequencies posttransplantation. PersistDST+ although remaining positive, showed weaker responses. Only dnDST+ patients showed a significant increase of spots number. (B) preDST− and postDST−: preDST mean 9.76 ± 7.2 IFN-γ spots/300.000 PBMC; postDST mean 5.28± 6.27 IFN-γ spots/300.000 PBMC (C) dnDST: postDST mean 70.7±55.9 spots/300.000PBMCs. (D) preDST+ and postDST−: preDST+ mean 67.04 ± 35.9 IFN-γ spots/300.000PBMC; postDST: mean 8.76±6.35 IFN-γ spots/300.000 PBMC (E) persistDST+: postDST mean 66.56±61.04 IFN-γ spots/300.000 PBMC. DST, donor specific T cell alloreactivity; preDST, pretransplant donor-specific T-cell alloimmune response; postDST, posttransplant donor specific T-cell alloreactivity; dnDST, de novo donor specific T-cell alloreactivity; persistDST, persistent donor specific T-cell alloreactivity.

