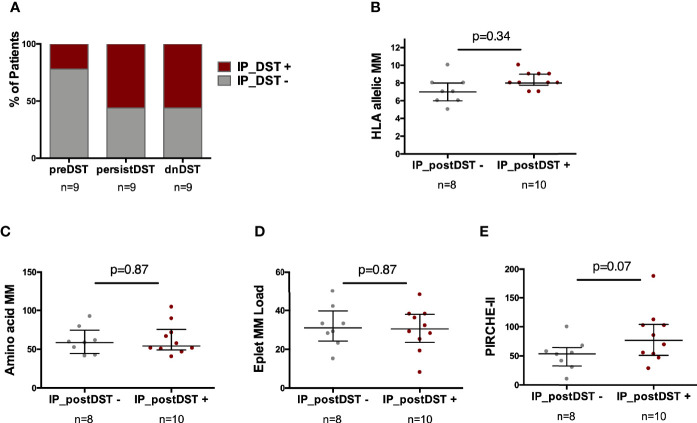
Figure 7.
Predominance of the type of alloantigen presenting pathway priming DST according to the time of DST assessment and association with distinct HLA MM scores. (A) Proportion of patients showing any degree of IP_ DST+ according to timing of DST assessment (preDST n=2/9, 22%; persistDST n=5/9, 56%; or dnDST n=5/9, 56%). (B) Distribution of HLA allelic MM between IP_postDST− (n=8) and IP_postDST+ patients (n=10): 7.12 ± 1.5 vs. 8.3 ± 0.95, p=0.34 (C) Amino acidic MM 60.5± 17.5 vs. 62.5 ± 20.4, p=0.87 (D) Eplet MM load 31.6 ± 10.8 vs. 30.1 ± 11.2, p=0.87 (E) PIRCHE-II 51.5 ± 26 vs. 83.9 ± 45, p=0.07. MM, mismatch; DST, donor specific T-cell alloreactivity; preDST, pretransplant DST; postDST, posttransplant donor specific T-cell alloreactivity; dnDST, de novo donor specific T-cell alloreactivity; IP DST, indirect pathway donor specific T-cell alloreactivity (with recipient APCs).

