
Figure 1.
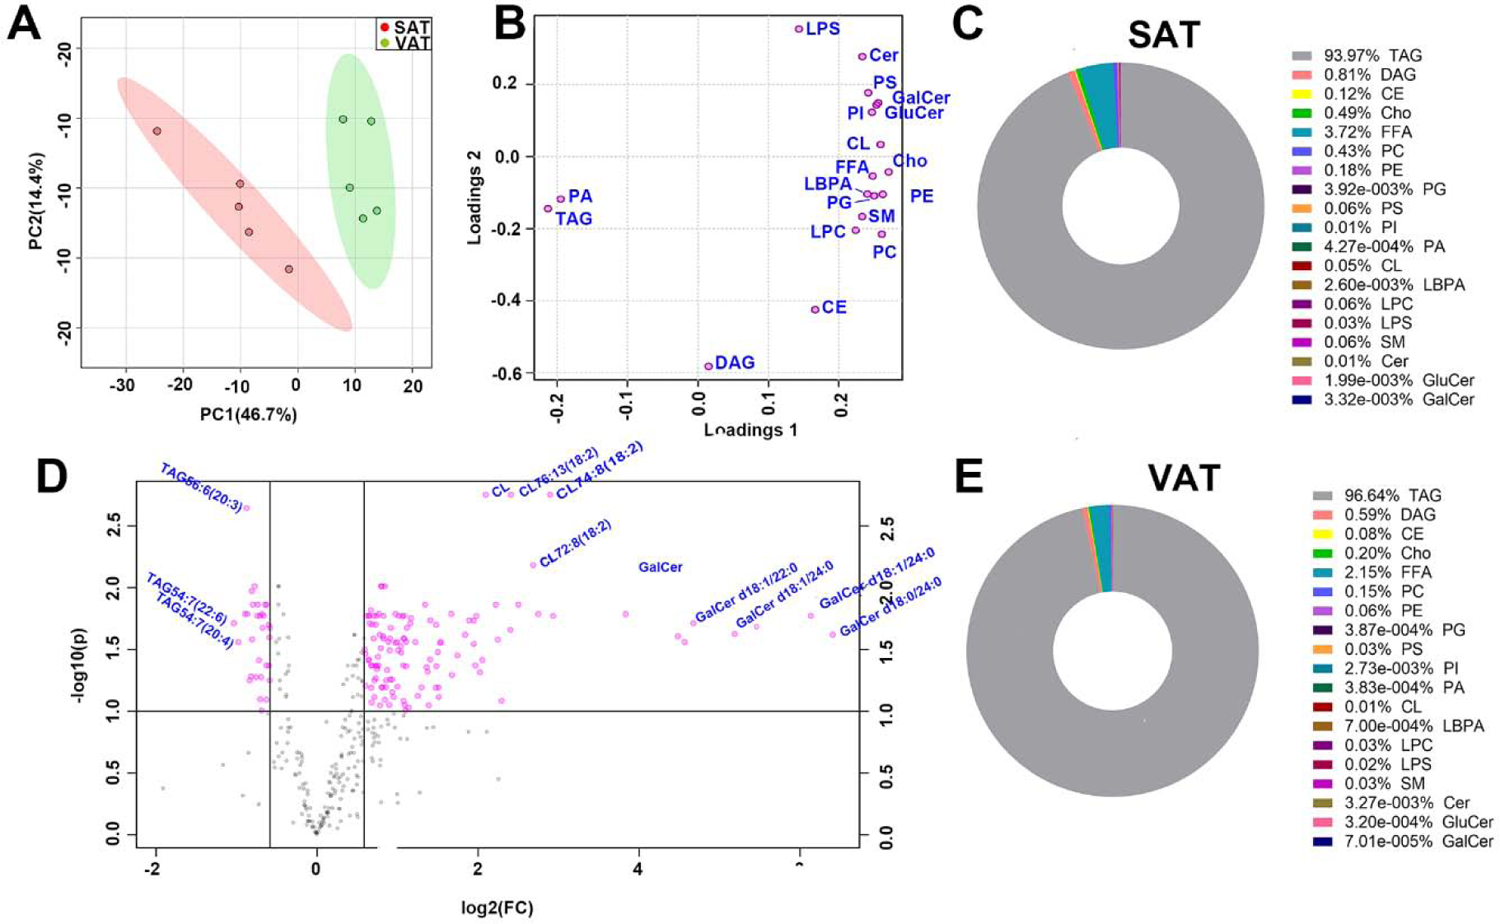
General analysis of subcutaneous and visceral adipose tissue lipidomics profiles in male C57BL/6J mice.(A) PCA analysis of whole lipidome of two WAT, (B) loading scores of PCA analysis for main lipid class, data are showed as SAT/VAT, (C) volcano plot of all lipid species detected from two adipose tissue, data are showed as SAT/VAT, FDR<0.05, fold change >1.5 is high lighted, (D) overall distribution of major lipid classes in SAT, (E) overall distribution of major lipid classes in VAT. n=5 per group.