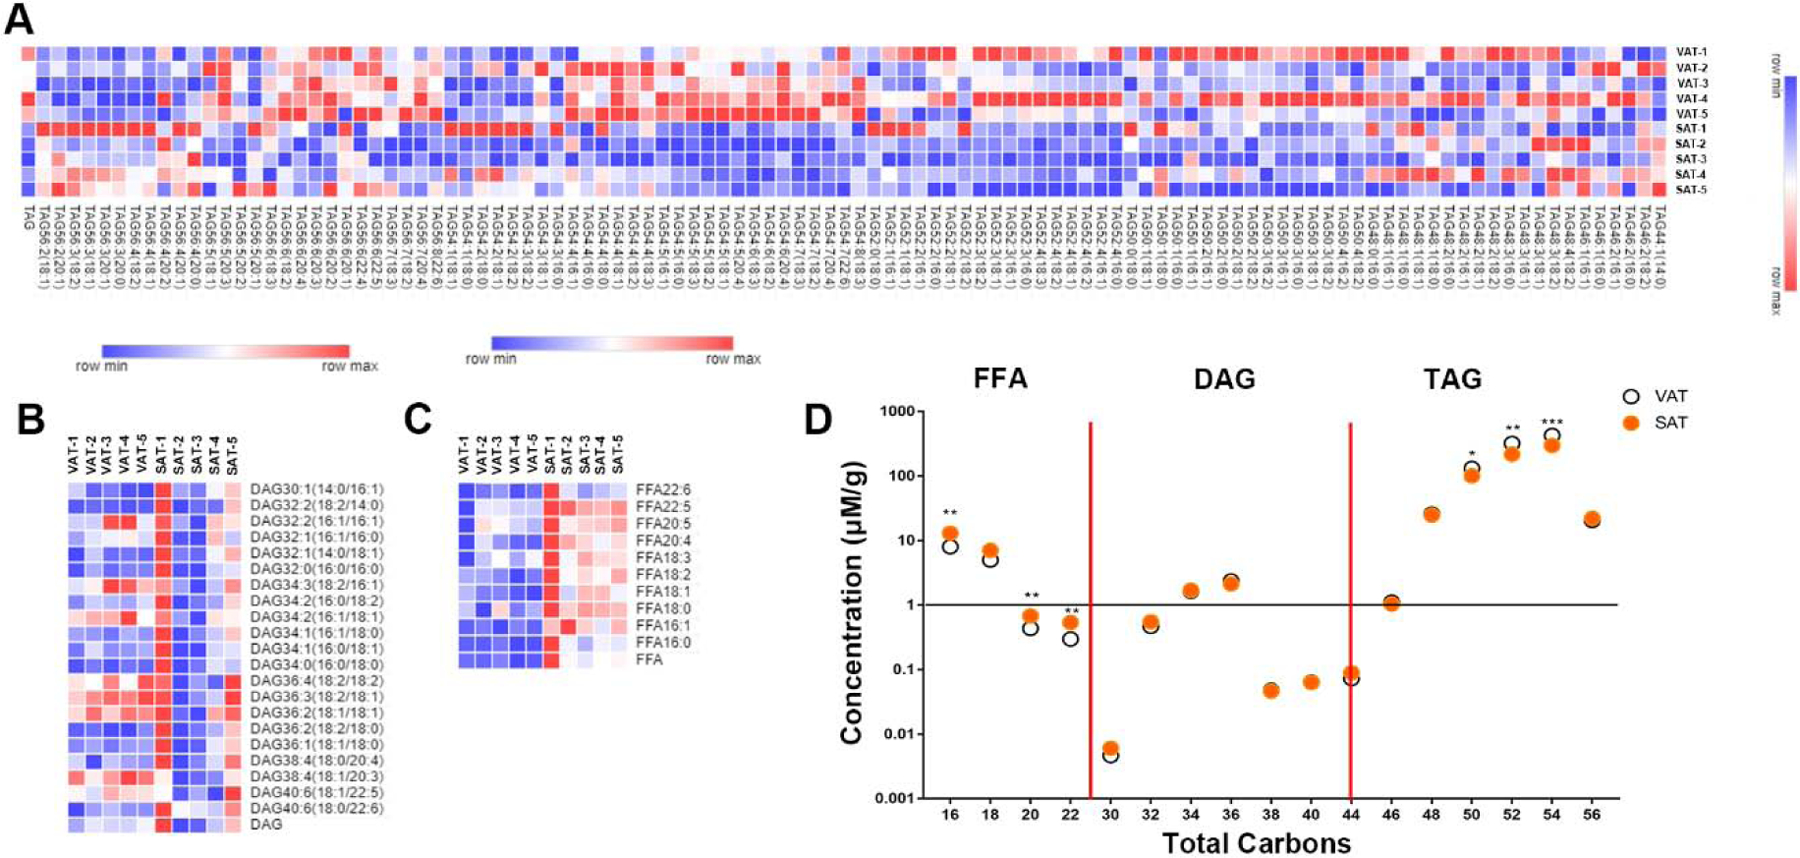
Figure 2.

Differences of glyceride and fatty acid between two of WAT. Heatmap analysis of TAG species (A), DAG species (B) and FFA species (C), total carbons changes were analyzed by FFA, DAG, TAG total concentrations (D).Data are presented by mean, n=5 per group, * P<0.05, ** P<0.01, *** P<0.001 compared with VAT.
