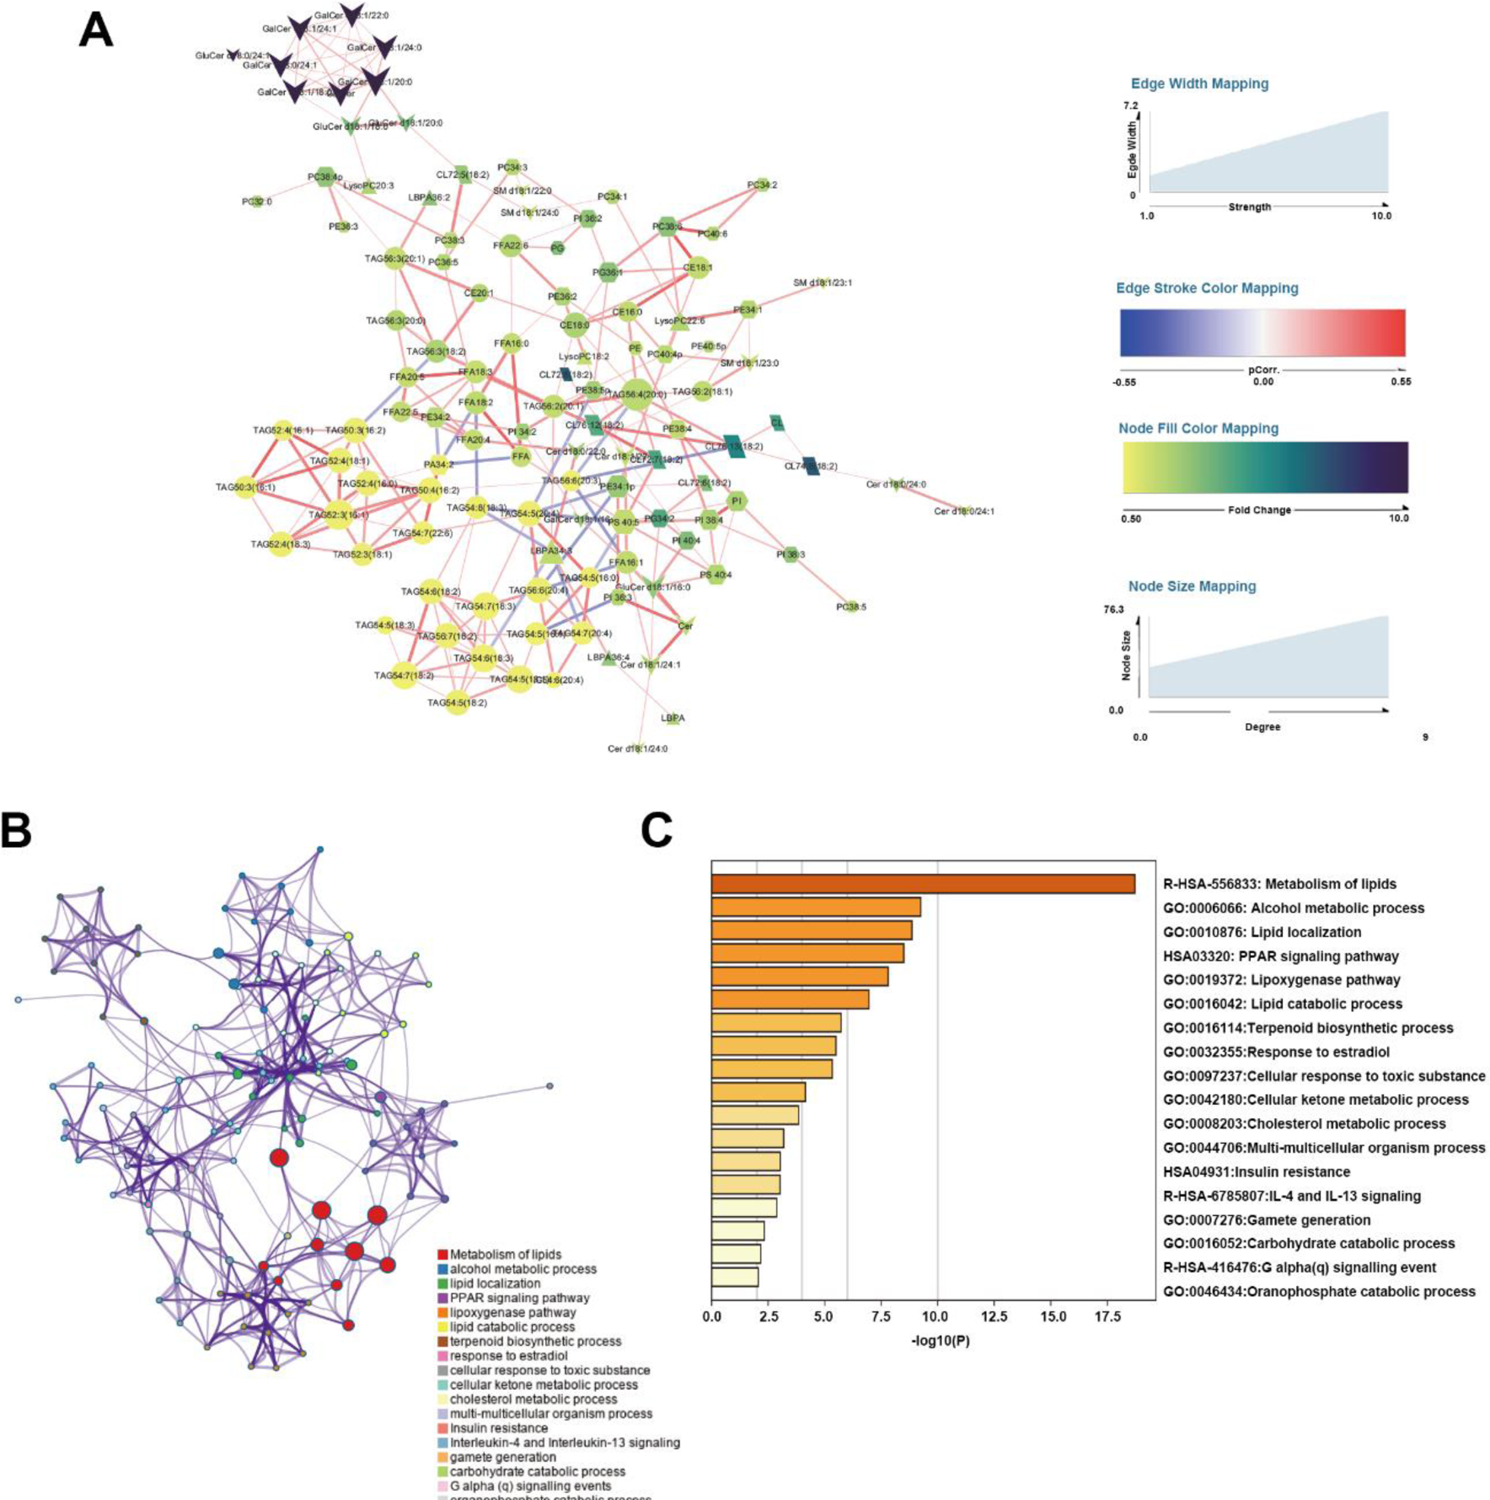
Figure 6.

Integrated transcriptomics and lipidomic network analysis. (A) Differential correlation of lipidomic network. Each nude with different shapes represented a lipid species. The size and color represented the connection degree and fold change of SAT/VAT respectively. The thickness of edges expressed the connection strength. The edge stroke color represented the p.correlation calculated as described in method. (B) Enriched Ontology Clusters, terms including GO/KEGG terms, canonical pathways, hall mark gene sets, etc., were represented by a circle node, where its size was proportional to the number of input genes fall into that term, and its color represented its cluster identity. Terms with a similarity score > 0.3 were linked, the thickness of edge represents the similarity score. (C) Heatmap of selected enrichment ontology
