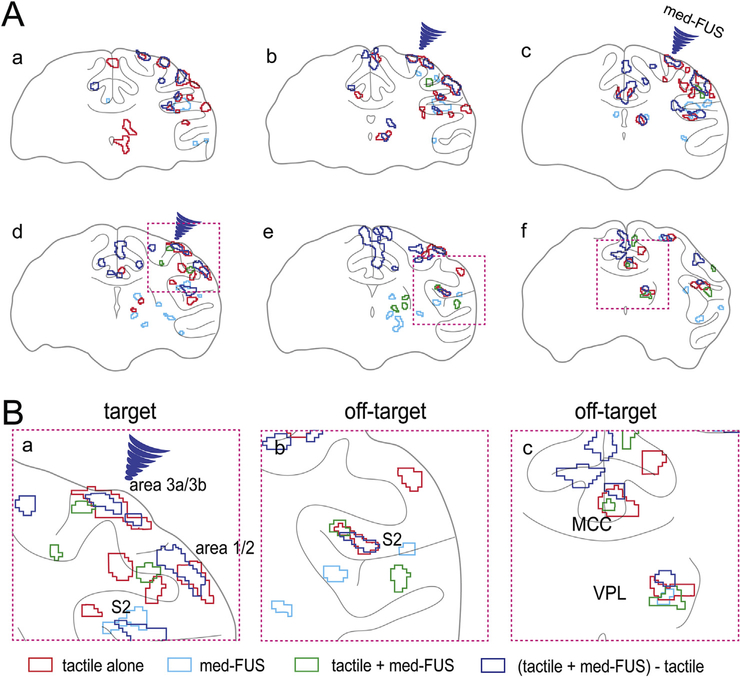
Fig. 4.
Spatial overlaps of fMRI activation foci in different experimental conditions. (A) The overlay of activation maps shown in Fig. 3 A–D. Blue arrowheads indicate the FUS beam focus. Three magenta dotted line boxes (d-f) indicate the field of views of zoomed-in illustration of the activation maps shown in B. (B) Zoomed-in views of composite four-condition BOLD activation maps show the spatial relationships of their corresponding evoked BOLD fMRI activation foci. Red outlines: tactile alone activation foci. Light blue outlines: activation to moderate intensity FUS. Green outlines: regions activated by simultaneous tactile + med-FUS stimulation. Blue outlines: regions exhibited greatest med-FUS induced BOLD signals difference.

