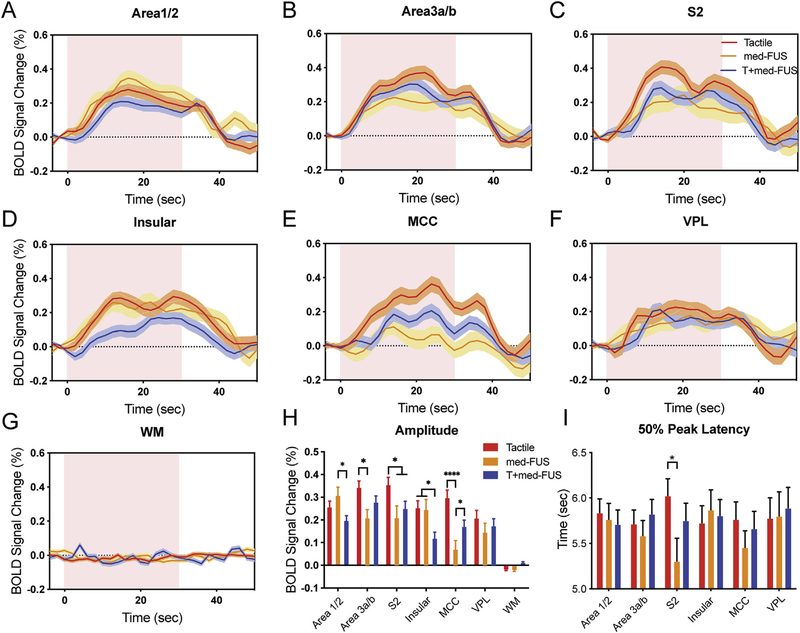
Fig. 6.
Comparison of time courses and peaks of BOLD signal changes in three stimulation conditions. (A-G) Time courses of % BOLD signal changes extracted from the all activated voxels (thresholded at t = 3.3) in six brain regions (area 1/2, area 3a/3b, S2, insular cortex, midcingulate cortex (MCC), ventroposterior lateral nucleus of thalamus (VPL)) and one control region in white matter (WM) during stimulation types: tactile alone (red), med-FUS alone (orange), and tactile + med-FUS (blue). Distribution of standard error indicated with a shade lighter than the mean lines. Pink background blocks indicate the 30-sec stimulation period. (H) Comparison of peak % BOLD signal changes in three stimulation conditions in each individual ROI. *p < 0.05, ****p < 0.001, one-way ANOVA followed by Tukey’s test. (I) Times to reach 50% peak BOLD signal changes in each individual ROI. FMRI data from a total of 23 tactile, and 19 med-FUS + tactile, and 9 med-FUS alone runs from six imaging sessions in two animals were included in the group quantification.

