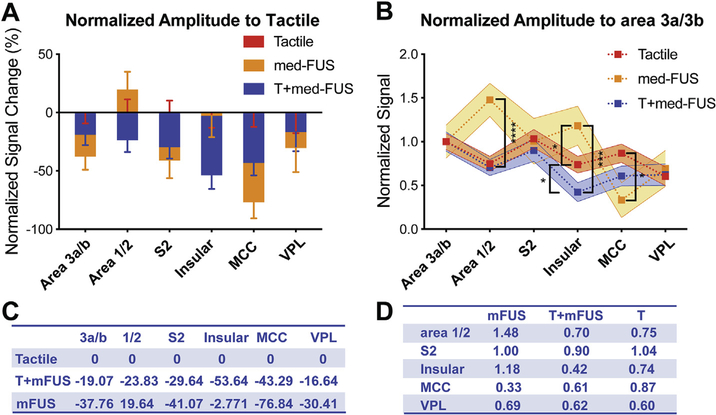
Fig. 7.
Differential modulatory effects of med-FUS on different brain regions. (A, C) Comparison of effects of med-FUS and med-FUS + tactile stimulation with respect to tactile responses (normalized % BOLD signal changes to tactile condition) across regions (A). Positive values indicate stronger than tactile responses and negative values indicate weaker than tactile responses. Table C shows the mean % BOLD signal changes for each condition in each area (C). (B, D) Comparison of modulatory effects of med-FUS + tactile and med-FUS alone to the tactile responses of off-target regions respect to the target of area 3a/3b. Shaded regions surrounding the dotted lines indicate the range of standard error at each ROI. *p < 0.05, **p < 0.01, ***p < 0.005, ****p < 0.001, unpaired t-test. Table D shows the mean % BOLD signal changes.

