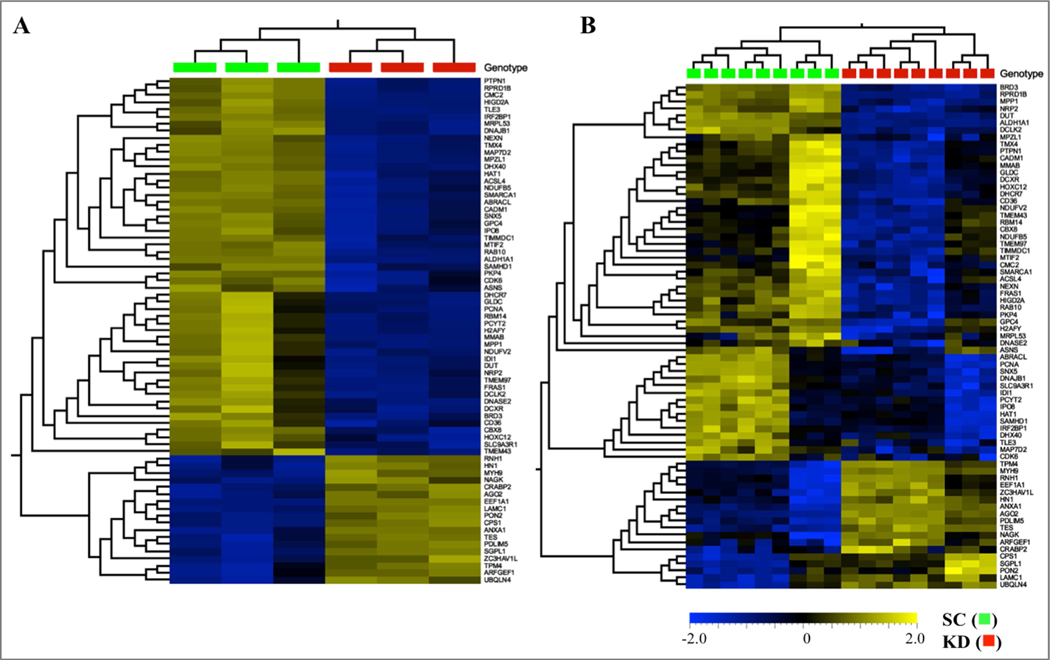
Figure 2:
Hierarchical clustering and heatmaps of 1747 differentially-expressed RNA transcripts (A) and 336 proteins (B) in scramble (scramble control, SC ■) and ALDH1A1 (knock down, KD ■) shRNA-transfected COLO320 cells. Scale bar ranges from −2.0 (light blue) to 2.0 (soft gold) Log2 Fold-Change. RNA transcripts were determined in three separate culture plates of SC and KD cells. Proteomic analyses (B) were determined in triplicate samples obtained from three separate culture plates of SC and KD cells.

