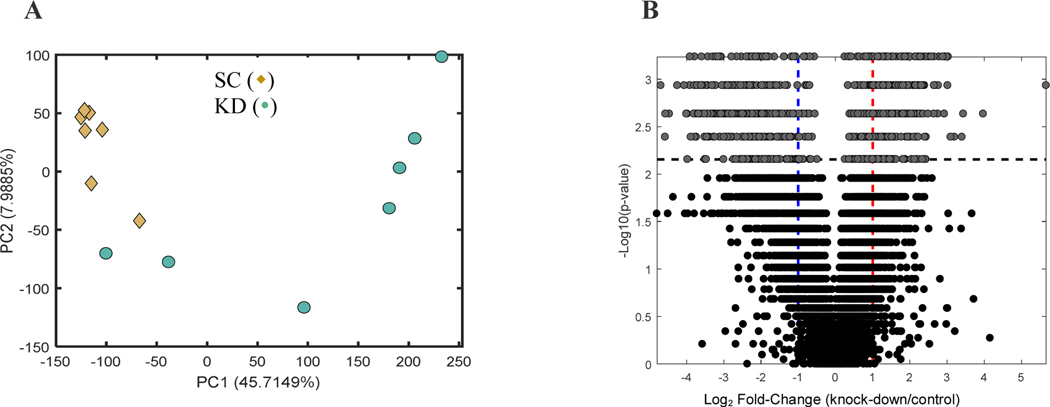
Figure 4:
A) Principal component analysis scores plot of control (scramble shRNA, ◆) and ALDH1A1 (knock-down, ●) COLO320 cells. B) volcano plot (univariate analysis) highlighting 859 significant ions. The horizontal dashed line in the panel shows the FDR-corrected critical p-value (q < 0.05), i.e. all points with p-values smaller tan the critical value (all values above the line) are the 859 ions for which the null hypothesis of no difference was rejected. The blue and red vertical dashed lines correspond to foldchanges of 0.5 and 2, respectively.

