. 2021 Mar 9;23(3):e24363. doi: 10.2196/24363
©Sandra Sülz, Hilco J van Elten, Marjan Askari, Anne Marie Weggelaar-Jansen, Robbert Huijsman. Originally published in the Journal of Medical Internet Research (http://www.jmir.org), 09.03.2021.
This is an open-access article distributed under the terms of the Creative Commons Attribution License (https://creativecommons.org/licenses/by/4.0/), which permits unrestricted use, distribution, and reproduction in any medium, provided the original work, first published in the Journal of Medical Internet Research, is properly cited. The complete bibliographic information, a link to the original publication on http://www.jmir.org/, as well as this copyright and license information must be included.
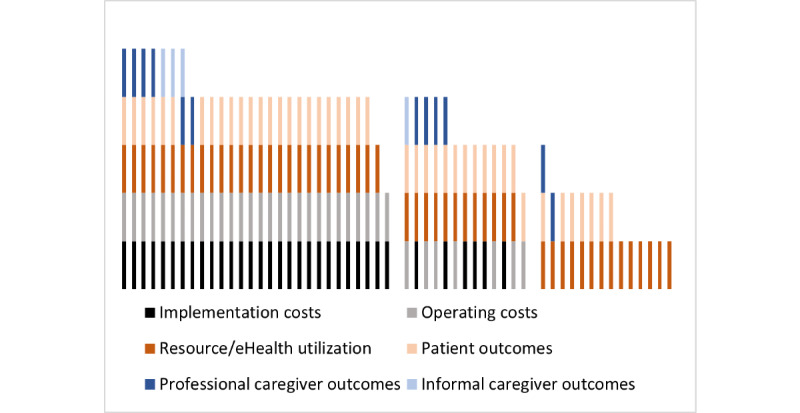
Figure 2.

Level of integration in 55 included studies (represented as bars).
