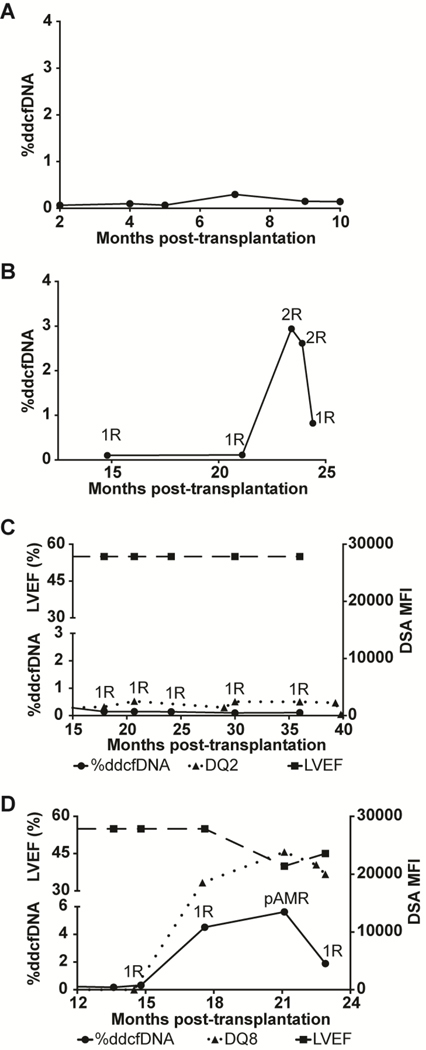
Figure 2: Reproducibility of %ddcfDNA patterns of rejection phenotypes in distinct patient cohorts.
Serial %ddcfDNA against time plots of two representative HTRs from the NIH cohort: (a) No rejection; (b) ≥ grade 2R ACR. Corresponding grading of EMB as: No-to-mild rejection (0R or 1R) or moderate to severe rejection (≥2R) are labeled for each %ddcfDNA measurement analyzed. Figures (c) and (d) are representative time plots of two subjects from the NIH cohort with donor-specific antibodies (DSA) against HLA Class II DQ antigens displaced as the mean florescence intensity (MFI-right y-axis) represented in dotted line. Graft function as measured by the left ventricular ejection fraction (upper left y-axis) is shown in the dashed line. The %ddcfDNA (lower left-y-axis) is shown in solid black line. pAMR label in (d) represents time of histopathologic and clinical diagnosis of AMR and initiation of treatment.

