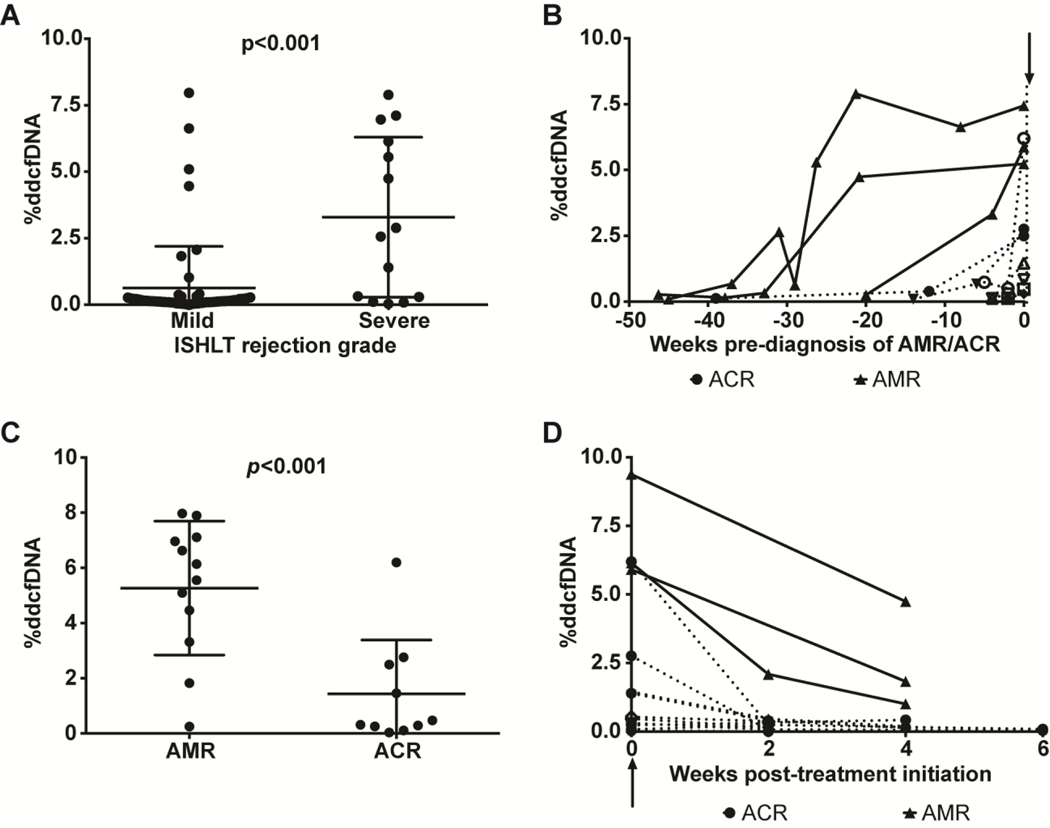
Figure 4: Correlation between %ddcfDNA and severity of graft injury.
a) The %ddcfDNA values were grouped as <grade 2R (no/mild) or ≥grade 2R rejection based on corresponding biopsy grades and compared (Mann-Whitney U test). (b) Temporal changes of %ddcfDNA preceding a histopathologic diagnosis of ≥grade 2R rejection. Arrow represents time of diagnosis of ≥grade 2R. Interval preceding ≥grade 2R diagnosis (x-axis) was computed by subtracting diagnosis date from sample collection date. Within-subject %ddcfDNA values are linked for subjects diagnosed with AMR (solid lines) or ACR (dashed lines). (c) The %ddcfDNA was compared for AMR vs. ACR diagnoses (Mann Whitney U test), showing significantly higher %ddcfDNA measurements associated with AMR compared to ACR. (d) Temporal changes of %ddcfDNA after initiation of treatment for rejection (arrow). The interval post-treatment was computed as the difference between sample collection date and treatment initiation date.

