
Figure 4. Supervised machine learning allows for analysis of human MKs.
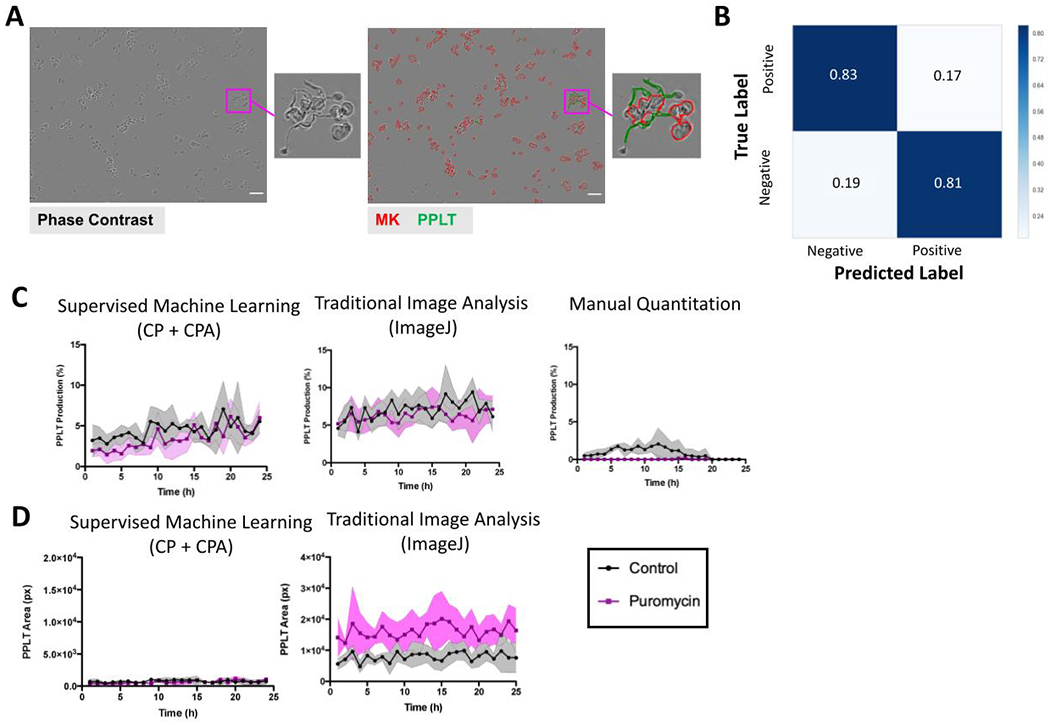
(A) Representative phase contrast and CellProfiler overlaid images of human CD34+ derived MKs (MKs, red) and proplatelet (PPLT, green) structures. Note the smaller size of proplatelet branches formed from human MKs compared to murine fetal-liver derived MKs, which has posed challenges for accurate detection using image analysis software. (B) A confusion matrix showing validation of the human MK pipeline. (C) Comparison of proplatelet quantification overtime between CellProfiler, ImageJ and manual counting (n=3 people). (D) Area (pixels) of MK and proplatelet objects were also compared to the values obtained via analysis with ImageJ. Scale bar is 50 μm. Data are mean ± SD (shaded regions) of n=3 independent experiments.