
Figure. 3. Constitutive, combinatorial YAP/TAZ deletion from Osterix-expressing cells impaired periosteal development in intact bone.
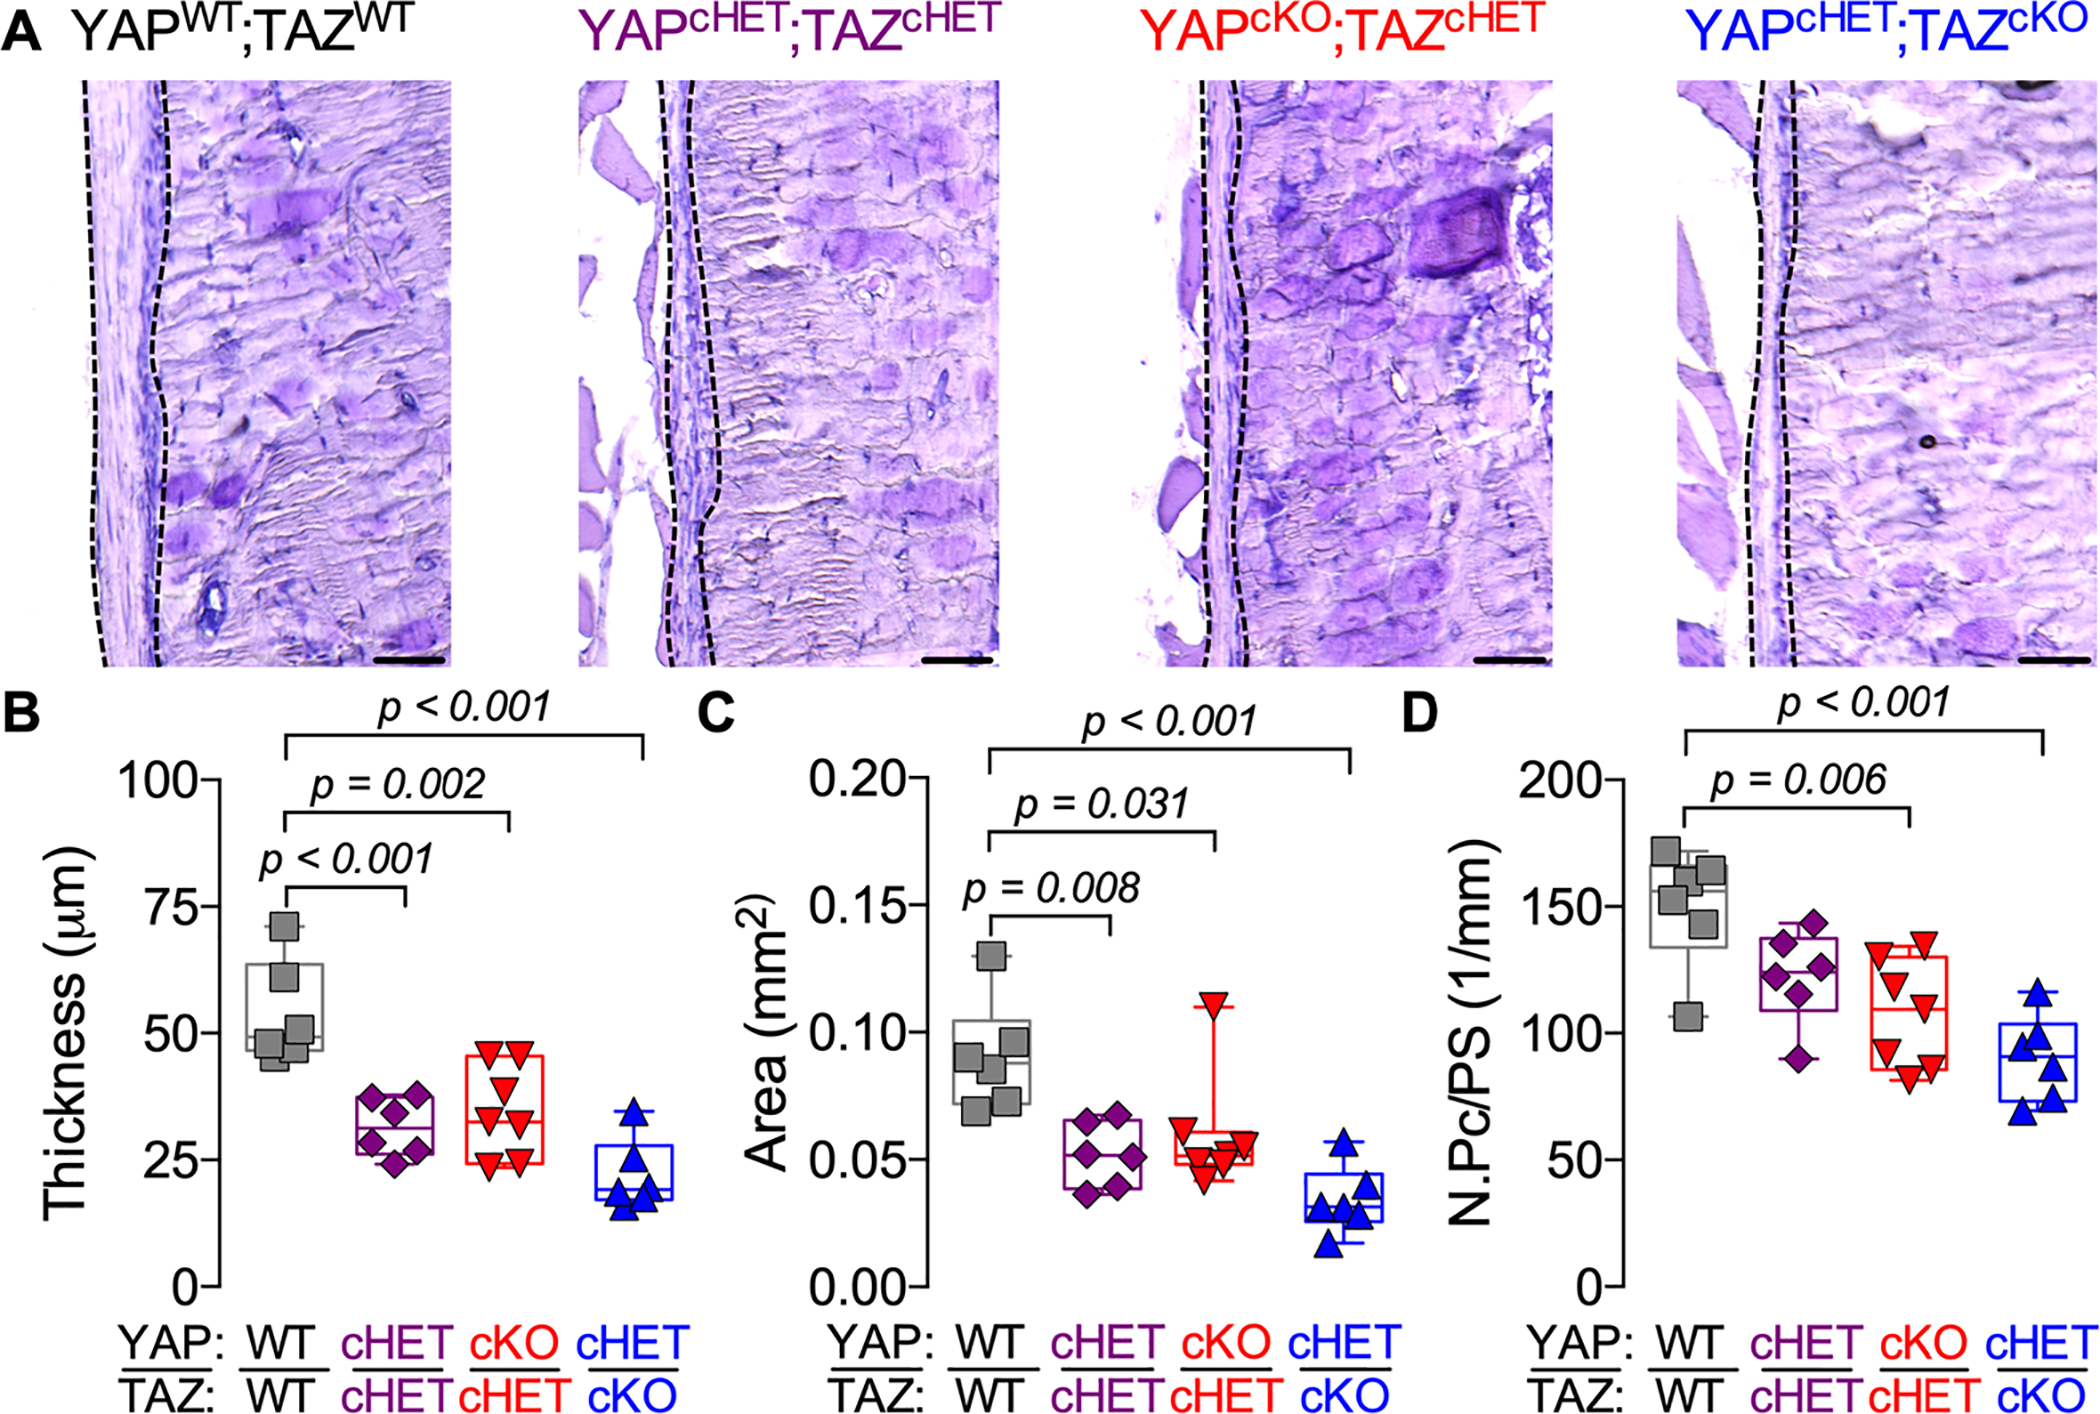
A) Representative micrographs of 18–21 weeks-old distal femur cortical bone stained by aqueous H&E. Dotted lines indicate the periosteum. Quantification of (B) periosteal thickness, (C) periosteal area and (D) periosteal cell number per bone surface (N.Pc /PS). Data are presented as individual samples in scatterplots and boxplots corresponding to the median and interquartile range. Data were evaluated by one-way ANOVA with post-hoc Tukey’s multiple comparisons tests. Groups with significant pairwise comparisons are indicated by bracketed lines p-values, adjusted for multiple comparisons. Sample sizes, N = 6–7. Scale bars indicate 50 μm for all images.