
Figure 4. Periosteal thickness and cellularity developed normally in adult onset-induced, Osterix-conditional, homozygous YAP/TAZ knockout mice.
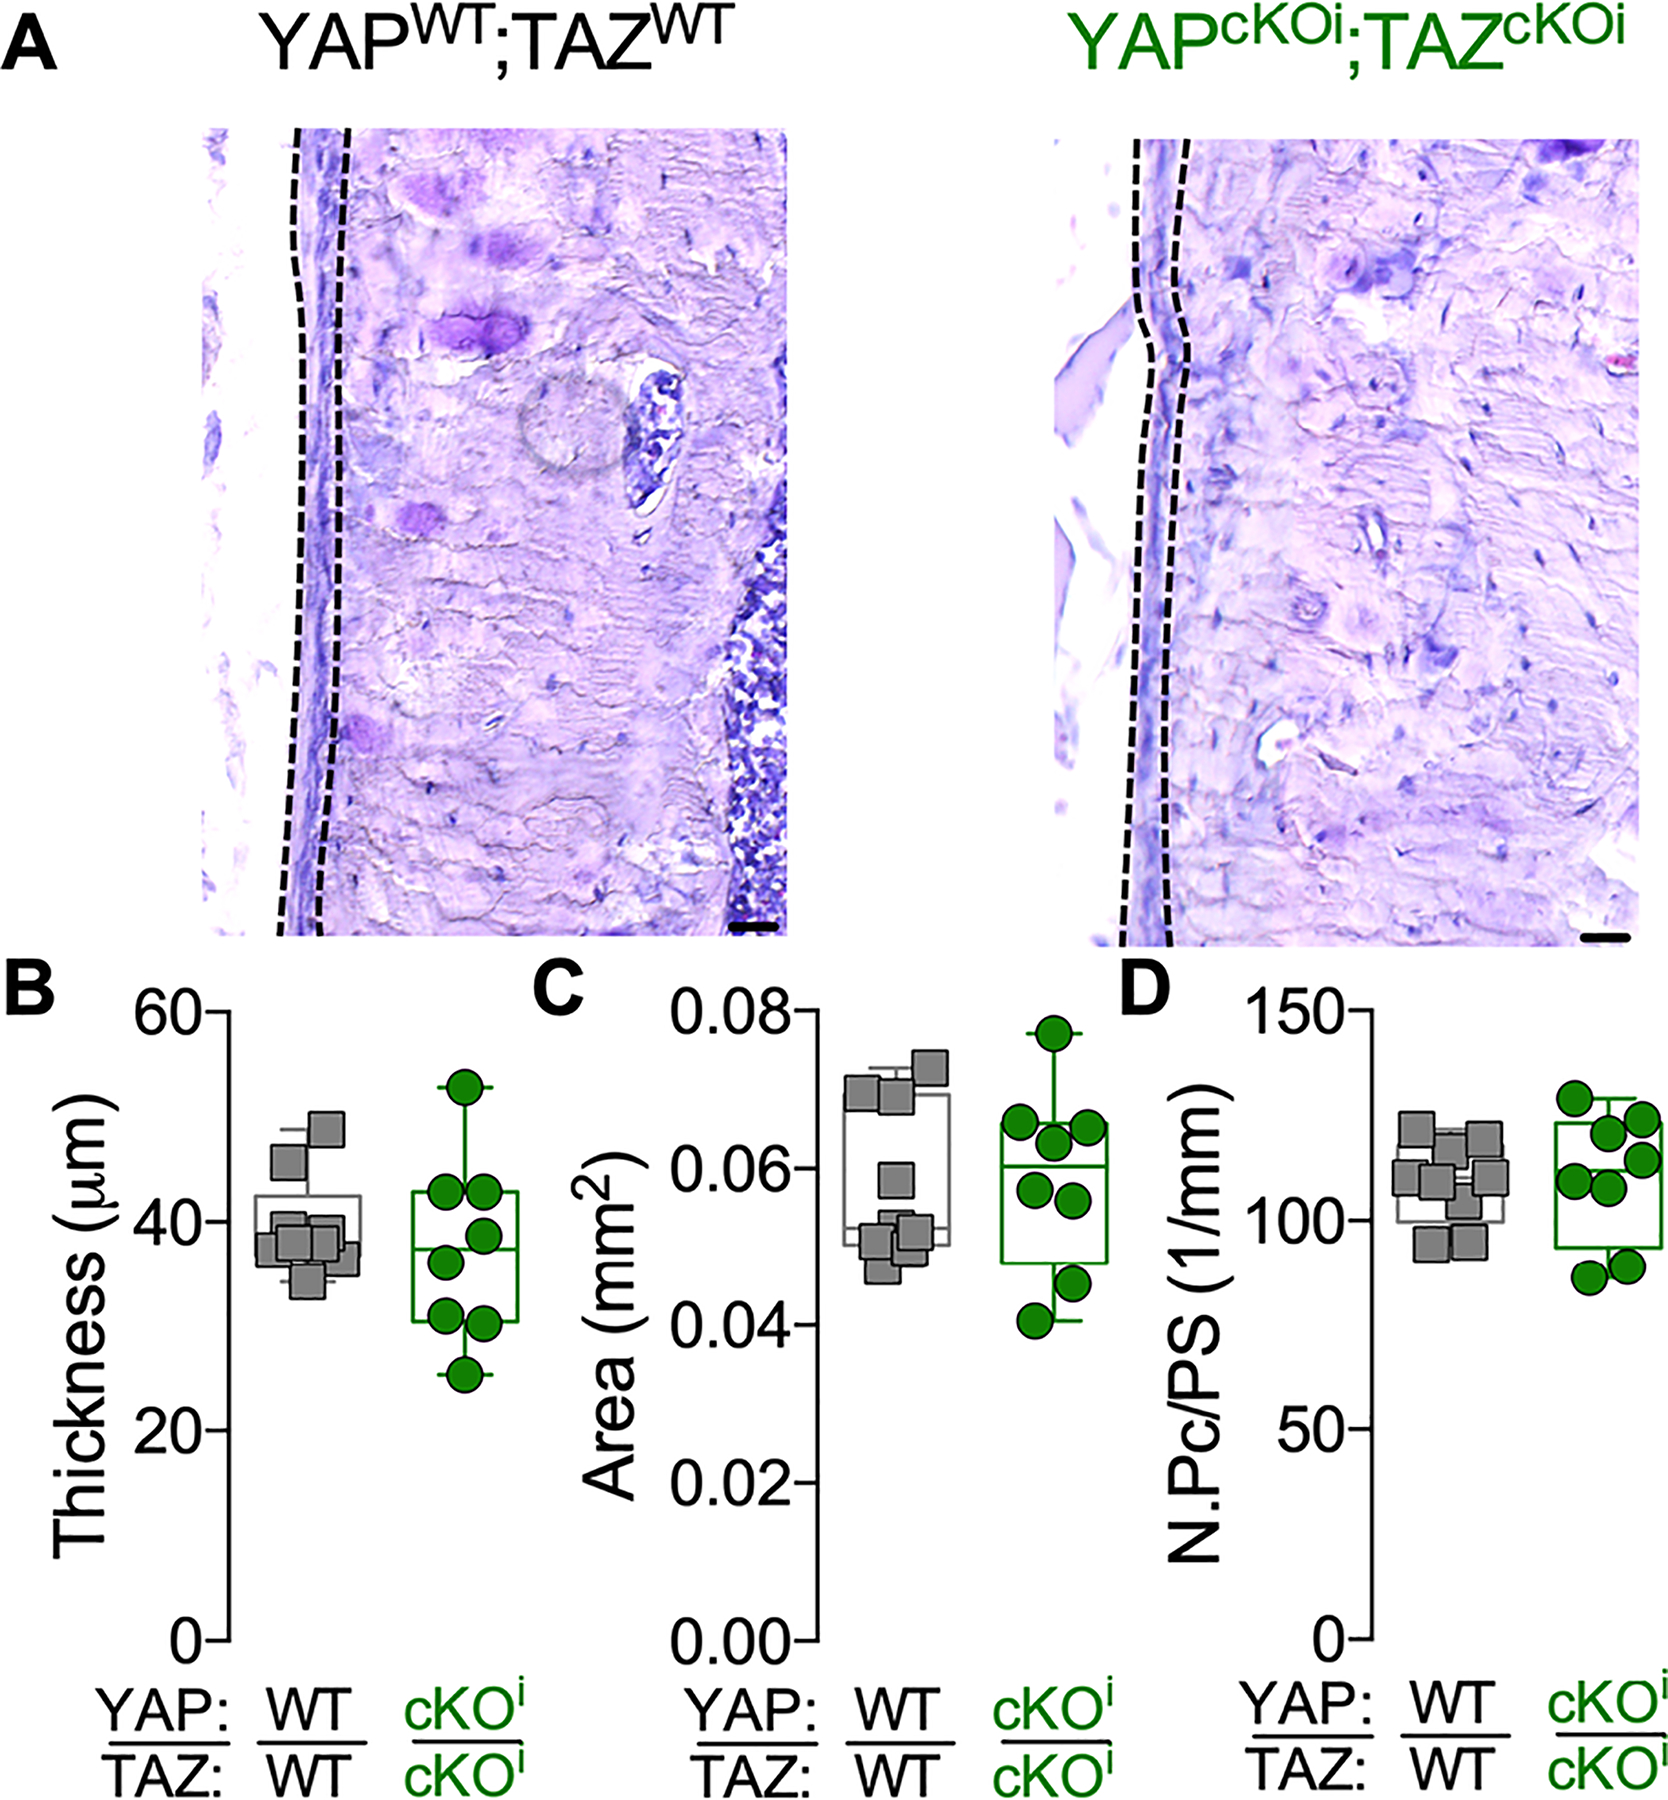
A) Representative micrographs of 16–18 weeks-old cortical bone stained by aqueous H&E. Dotted lines indicate the periosteum. Quantification of (B) periosteal thickness, (C) periosteal area and (D) periosteal cell number per bone surface (N.Pc/PS). Data are presented as individual samples in scatterplots and boxplots corresponding to the median and interquartile range. Groups were compared by two-tailed Student’s t-test. There were no significant differences between groups. Sample sizes, N = 8–9. Scale bars indicate 30 μm for all images.