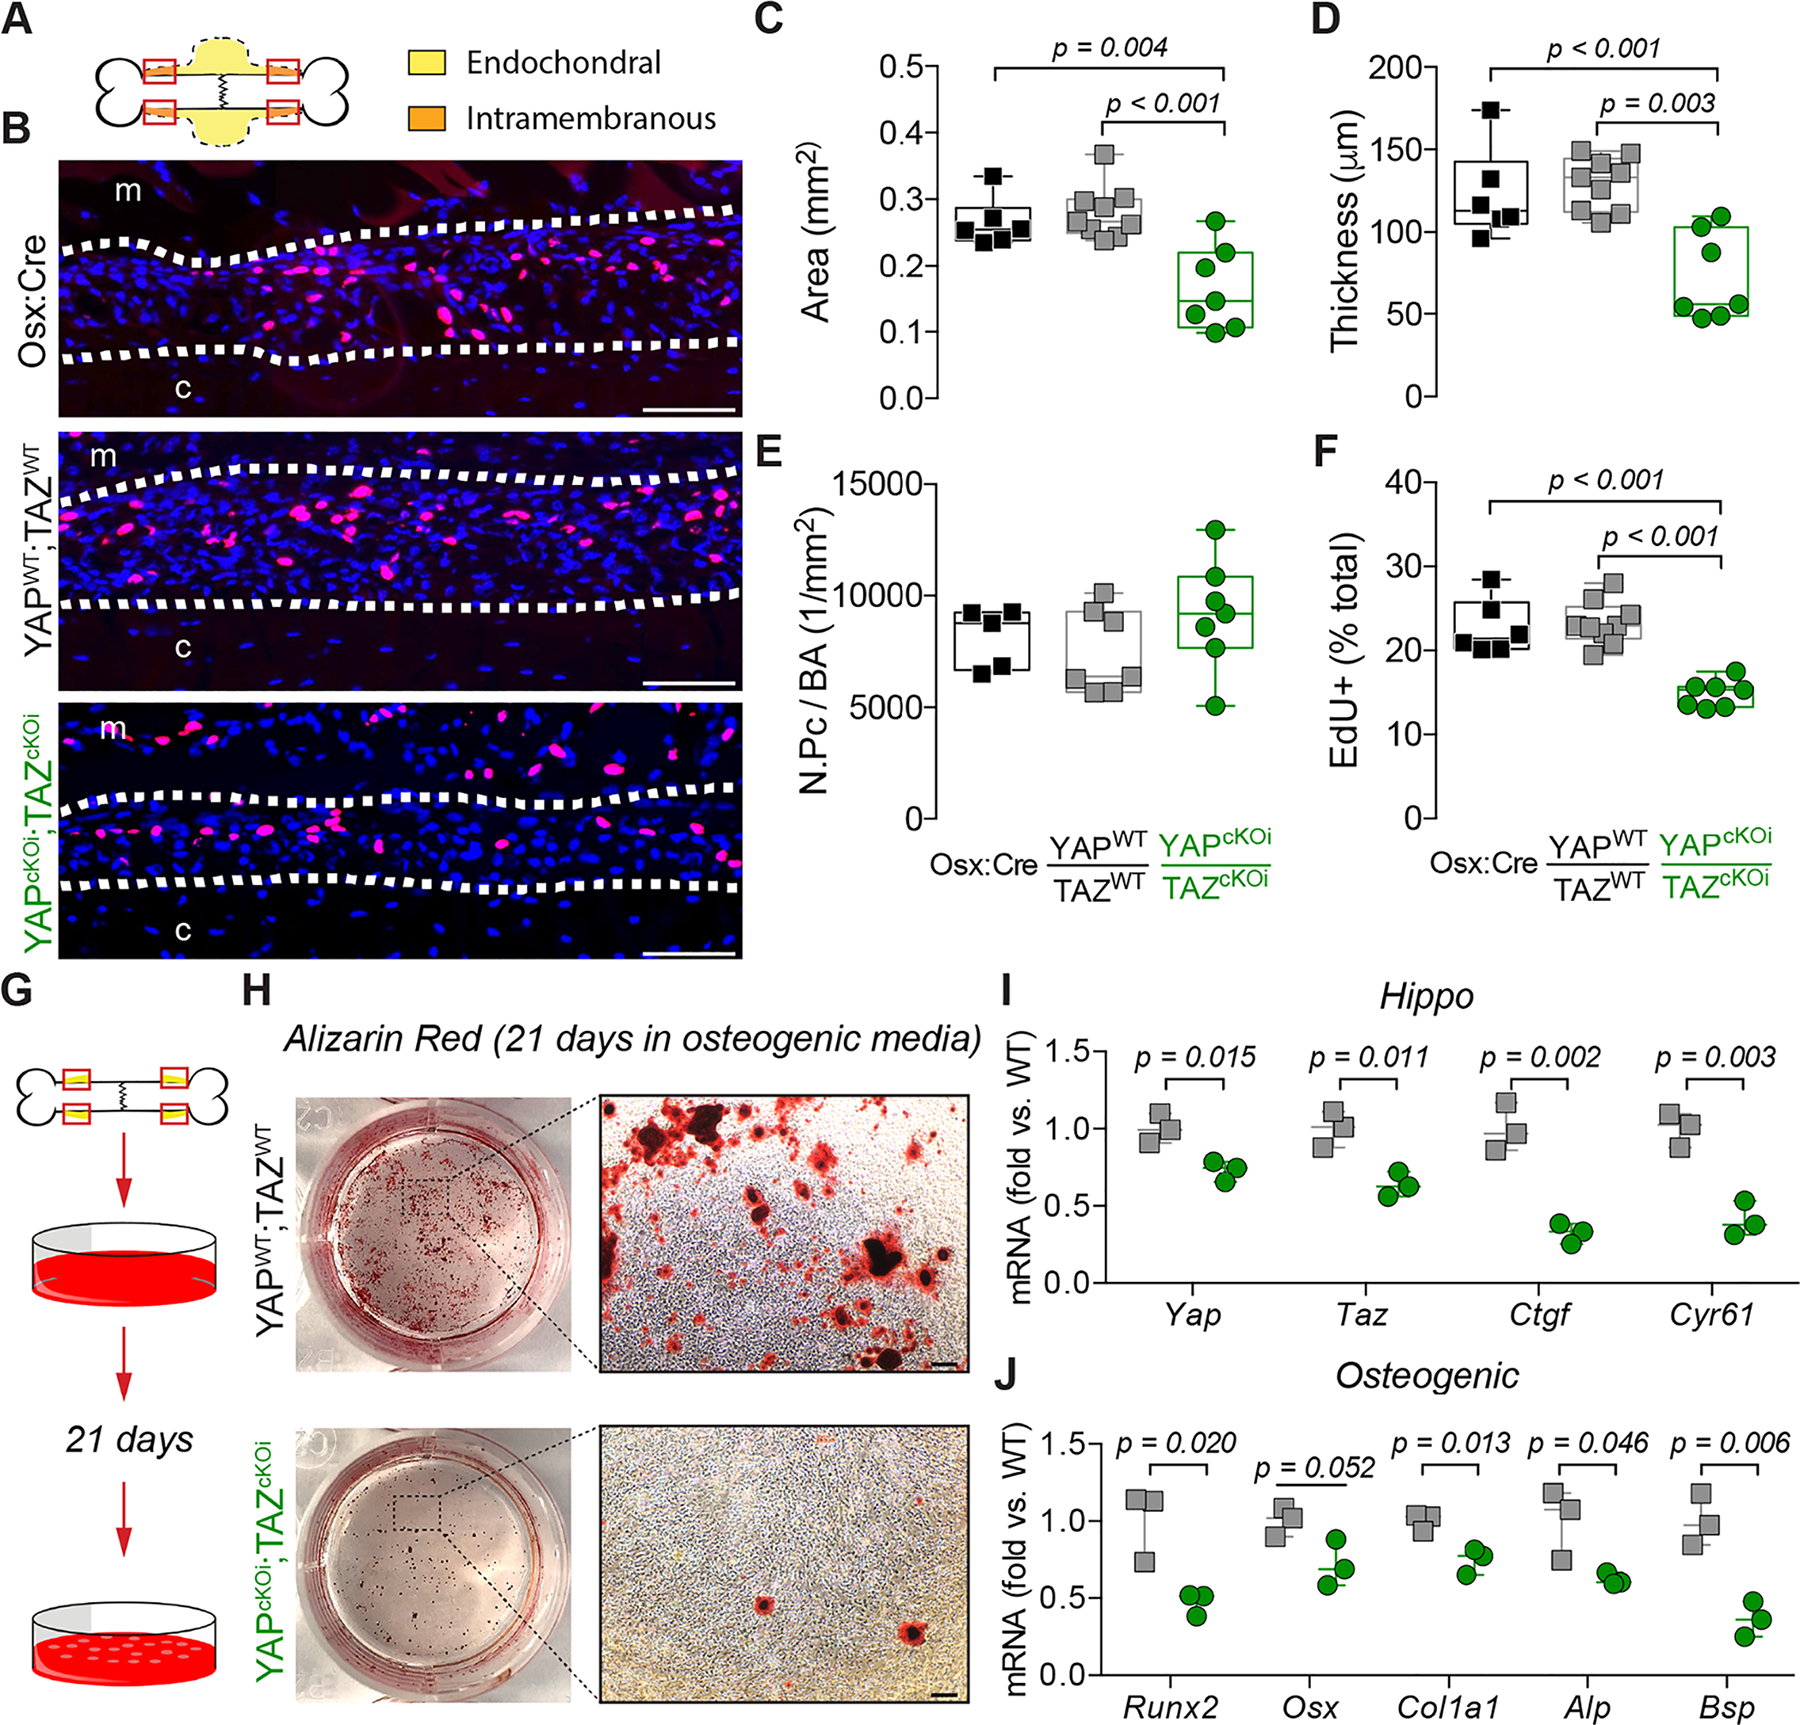
Figure 7. Adult onset-inducible, homozygous YAP/TAZ deletion from Osterix-expressing cells impaired periosteal osteoblast precursor cell expansion and osteogenic differentiation.

A) Representation of the regions of interest in the callus “shoulder,” where bone formation initiates by intramembranous ossification, and where we evaluated periosteal osteoblast precursor expansion and proliferation. B) Representative micrographs of EdU+ periosteal cells (red) at 4 dpf, with all nuclei counterstained by DAPI (blue). White dotted lines indicate periosteal cell expansion zone; “m” indicates muscle, “c” indicates cortical bone. Quantification of the expanded (C) periosteal area, (D) average thickness, (E) number of periosteal cells per bone area (N.Pc/BA), and (F) percentage of EdU-positive periosteal cells. G) Activated periosteal cells isolated from 4 dpf limbs were cultured in osteogenic media for 21 days. H) Representative Alizarin Red staining of mineral deposition following osteogenic induction. I) Yap, Taz, Ctgf, and Cyr61 and J) Runx2, Osx, Alp, and Bsp mRNA expression, relative to 18S rRNA, from periosteal progenitor cell cultures following 21 days of osteogenic induction. Data are presented as individual samples in scatterplots and boxplots corresponding to the median and interquartile range. Data were evaluated either by one-way ANOVA with post-hoc Tukey’s multiple comparisons tests, or by two-tailed Student’s t-tests. Groups with significant pairwise comparisons are indicated by bracketed lines and p-values, adjusted for multiple comparisons. N = 6–9 per group for in vivo data and N = 3 for in vitro data. Scale bars indicate 100 μm for all high-power EdU images and 1 mm for high-power Alizarin Red images.
