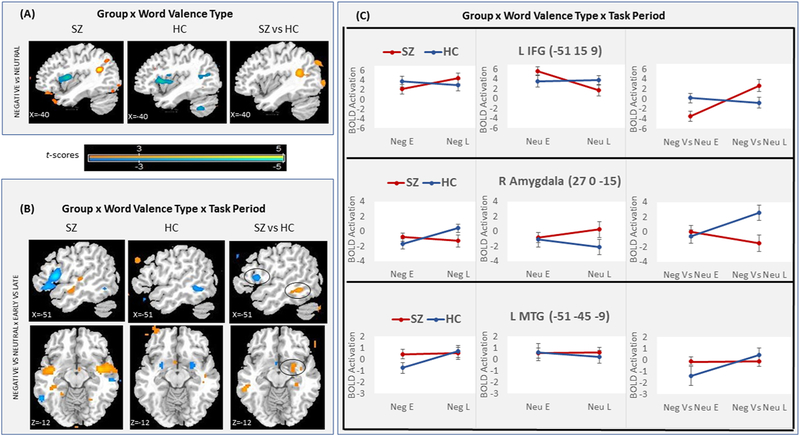
Figure 2:
Brain activation in SZ and HC. (A) fMRI t-maps of the Neg versus Neu contrast for within-SZ, within-HC, and SZ versus HC. (B) fMRI t- maps of the Neg versus Neu × Early versus Late interaction for within-SZ, within-HC, and SZ versus HC. (C) BOLD response effect sizes (in %) at the left IFG, right amygdala, and left MTG/ITG peaks (indicated by black circles in B), for Neg, Neu, and Neg versus Neu words, in early (E) and late (L) task periods, in SZ and HC. For visualization, fMRI maps shown at voxel-wise p<0.01.

