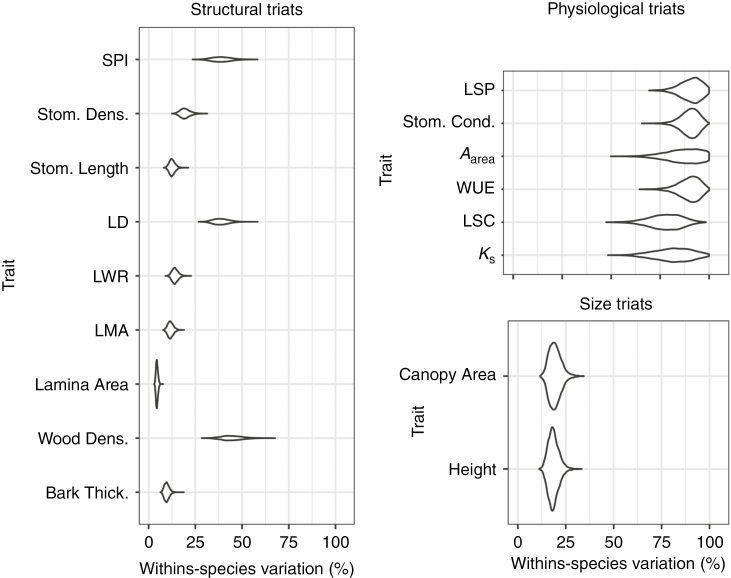
Fig. 4.
Posterior distributions of the within-species variance for all structural, physiological and size traits estimated using a random intercept model. The entire posterior distribution is plotted for each trait to demonstrate the mean estimate of the within-species proportional variance in addition to the uncertainty associated with variance partitioning estimates.

