Fig. 6.
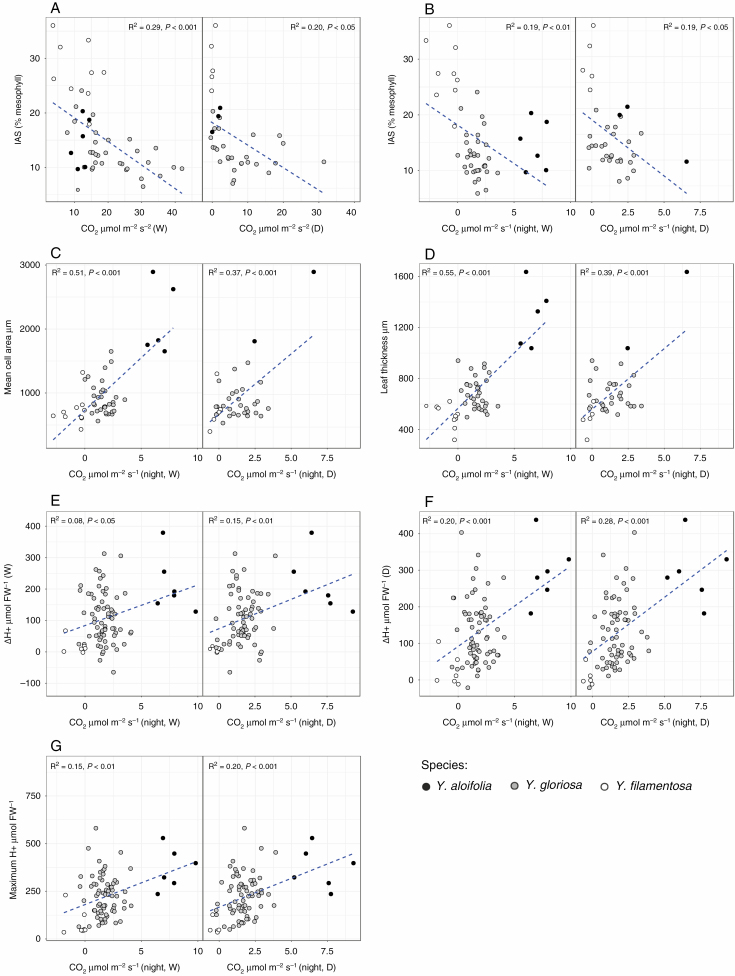
Scatterplots and regression lines with R2 and P-values for a subset of traits (Supplementary Data Fig. S4). Individual data per plant are plotted, and correlations are shown for individual plant data across all three species together, rather than genotypic means (Table S5). (A) Total CO2 assimilation under watered (W) and drought (D) plotted against intercellular airspace (IAS). (B–G) Nocturnal CO2 assimilation under watered and drought plotted against IAS (B), mean mesophyll cell area (C), leaf thickness (D), leaf acid accumulation under watered (E) and drought (F) treatments, and against the maximum amount of acid present at any time point (G). Leaf acidity measurements are per gram of frozen weight (f. wt).

