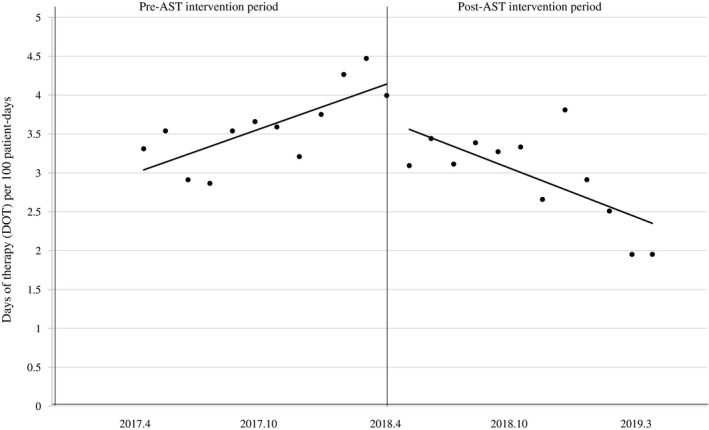
FIGURE 2.

The line graph shows a segmented linear regression of therapy duration (days of therapy per 100 patient‐days) during the pre‐ and post‐AST intervention periods. The trend of carbapenem use increased during the pre‐AST intervention period (β1 = 0.101, P = .007). After the AST intervention, the level (β2 = −0.686, P = .049) and the slope decreased (β3 = −0.211, P < .001)
