Fig 2.

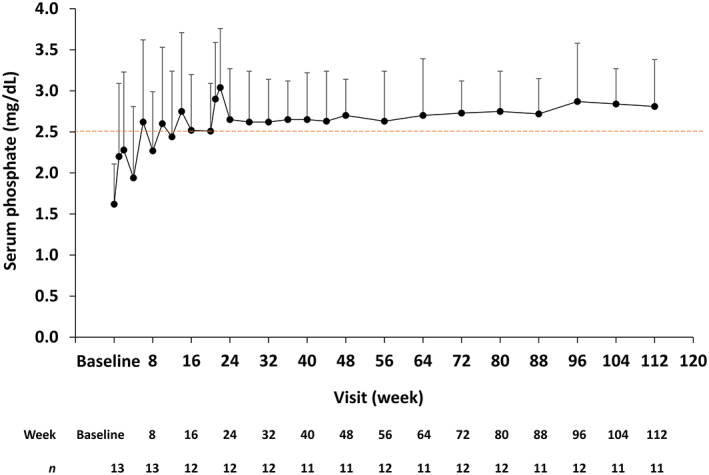
Serum phosphate level over time. Data are shown as mean + standard deviation. The lower limit of the normal range (2.5 mg/dL) is indicated. The number of observations at each time point are shown below the graph.

Serum phosphate level over time. Data are shown as mean + standard deviation. The lower limit of the normal range (2.5 mg/dL) is indicated. The number of observations at each time point are shown below the graph.