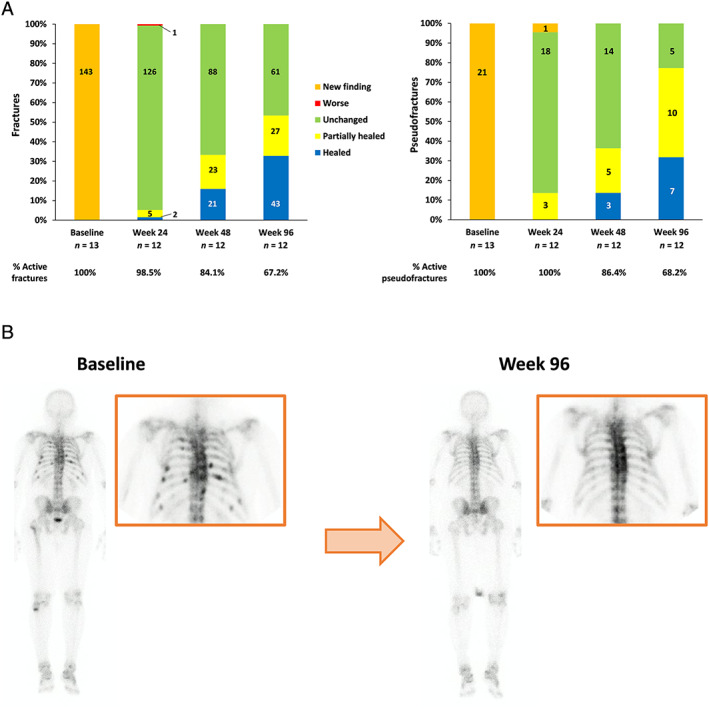
Fig 4.

Outcomes of the 99mTC bone scan. (A) Evaluation of fractures and pseudofractures. (B) A 99mTc‐labeled bone scan image of a 57‐year‐old male at baseline and at week 96. For the evaluation of fractures and pseudofractures, the % value (the percentage of active fractures remaining, ie, any status other than “healed”) was calculated as the count of each item/total count of each visit.
