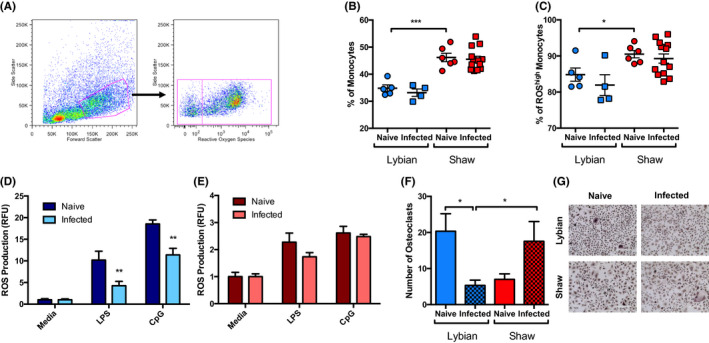
FIGURE 2.

Acanthocheilonema viteae modulates host myeloid immune responses. Bone marrow cells from naïve or infected M libycus or M shawi jirds were collected at cull and subjected to red blood cell lysis and stained for the presence of ROS. Representative FACS plots of forward and side scatter identified a population of cells intermediate in granularity and large in size, reminiscent of monocytes that produce a high amount of ROS (A). The % of these monocyte‐like cells (B) and the % of ROShigh cells (C) were calculated. The data are combined from two experiments, and all data points reflect individual jirds with M libycus naïve, n = 5; M libycus infected, n = 4; M shawi naïve, n = 6; and M shawi infected, n = 13. BM‐derived macrophages (BMMS) were stimulated with 0.1 µg/mL of LPS or 5 µmol/L CpG, and ROS production after 24 h of stimulation was measured and normalized to medium controls for naïve and infected M libycus (D) and M shawi (E) jirds with each animal examined in triplicate. The data are combined from two experiments with M libycus naïve, n = 3 (9 technical replicates); M libycus infected, n = 3 (9 replicates); M shawi naïve, n = 3 (9 replicates); and M shawi infected, n = 6 (18 replicates). BM cells were also cultured in the presence of mouse M‐CSF and RANKL for 6 d and stained using TRAP; the numbers of multi‐nucleated TRAP + osteoclasts (F) and representative images of osteoclasts are shown (G; scale bar = 200 µm). The data are combined from three experiments with each animal examined in triplicate with M libycus naïve, n = 3 (9 technical replicates); M libycus infected, n = 5 (15 replicates); M shawi naïve, n = 3 (9 replicates); and M shawi infected, n = 6 (18 replicates). The data are presented as mean ± SEM and one‐ or two‐way ANOVAs with LSD Fisher's or Tukey's post‐tests were used to analyse species differences, where * = P < .05, ** = P < .01, and *** = P < .001
