FIGURE 2.

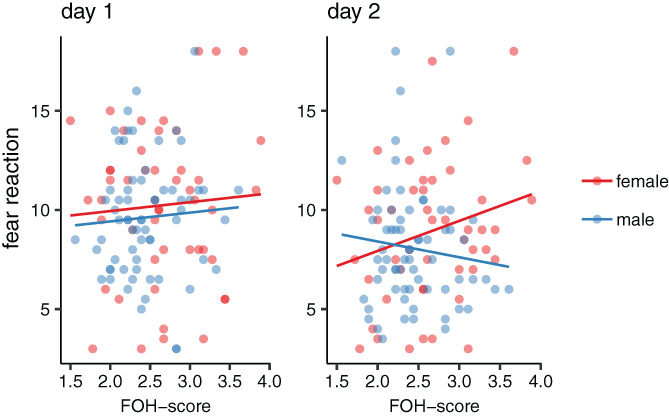
Scatterplots of fear reactions (area under the curve) in the fear habituation test plotted against fear‐of‐human (FOH) score in males and females

Scatterplots of fear reactions (area under the curve) in the fear habituation test plotted against fear‐of‐human (FOH) score in males and females