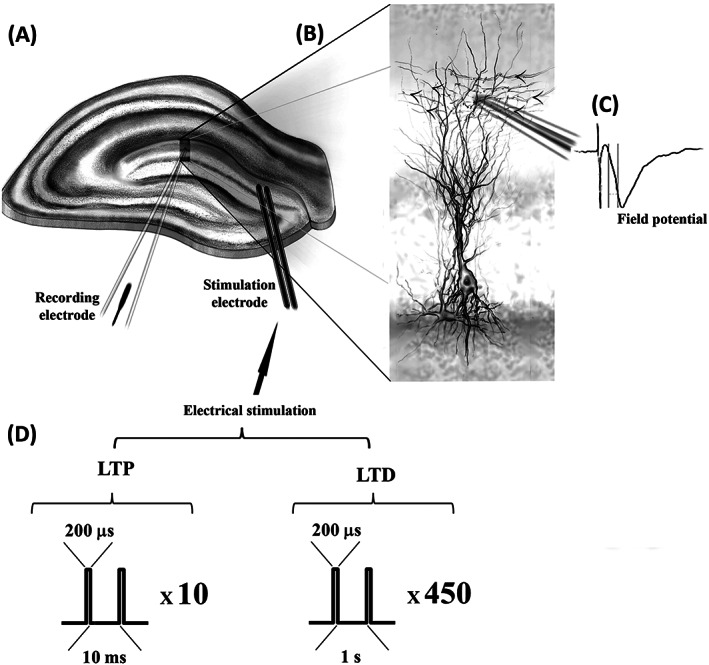
FIGURE 1.

Schematic representation of the electrophysiological experimental setting. A, Diagram of a hippocampal slice with the positioning of the stimulating and recording electrodes at the neurogenic dentate gyrus. Simulating electrodes are positioned upstream of the middle molecular layer to stimulate the medial perforant path. B, The inset depicts a recording electrode positioned at the dendritic layer of neuronal granule cells, with arrows indicating the direction of the inputs from the perforant path. C, A representation of a recorded extracellular field potential is shown to the right. D, Diagrams of the protocols of electrical stimulation delivered through the stimulation electrodes are described for long‐term potentiation (LTP) and for long‐term depression (LTD) (see also Section 2)
