
FIGURE 4.
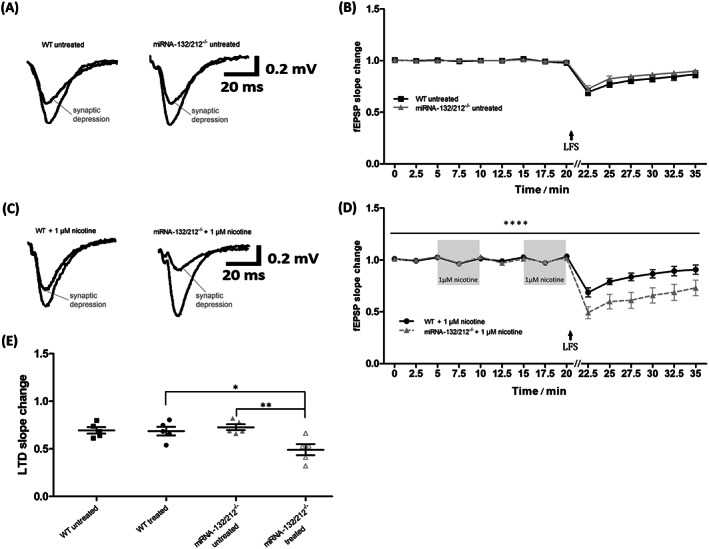
Nicotine stimulation promotes synaptic depression in hippocampal dentate gyrus of miRNA‐132/212 gene knockout. A, Representative traces of field excitatory postsynaptic potentials (fEPSPs), recorded at baseline conditions and after the application of synaptic depression‐inducing protocols, from untreated hippocampal slices derived from untreated wild‐type controls and untreated miRNA‐132/212−/− mice. The responses generated after delivery depression‐inducing electrical stimulation were taken at 22.5 min and are indicated as “synaptic depression” in the graph. B, Temporal course of the changes in fEPSPs slopes as recorded before and after the application of depression‐inducing protocols in hippocampal slices from untreated wild‐type and untreated miRNA‐132/212−/− mice. No statistically significant differences were observed between the groups. C, Representative traces of fEPSPs, recorded at baseline conditions and after the application of depression‐inducing protocols, from untreated hippocampal slices derived from untreated wild‐type controls and untreated miRNA‐132/212−/− mice. The responses generated after delivery of electrical stimulation are indicated as “synaptic depression” in the graph and were obtained after the dual application of 1‐μM nicotine, which was delivered during baseline conditions as described below. D, Temporal course of the changes in fEPSPs slopes as recorded before and after the application of depression‐inducing protocols in hippocampal slices from untreated wild‐type and untreated miRNA‐132/212−/− mice. Two consecutive pulses of 5‐min exposure to 1‐μM nicotine, spaced by a 5‐min washout period, preceded the delivery of the application of potentiation‐inducing protocols as illustrated in the figure in the shadowed box insets. While slices from wild‐type (n = 5) and untreated miRNA‐132/212−/− (n = 5) mice presented both with synaptic depression responses, synaptic depression was however statistically much more pronounced in the miRNA‐132/212−/− group. E, Scatter plots showing the field responses after delivering synaptic depression‐inducing protocols (Section 2) in all four investigated groups at 22.5 min (2.5 min poststimulation). Mean and SEM are indicated by the black horizontal lines; error bars are presented as SEM. The low‐frequency stimulation protocol used to induce depression was delivered right after the recording obtained at 20 min as indicated in the figure (LFS + arrow). Data are presented as mean ± SEM. Please see details for the statistics on the main text